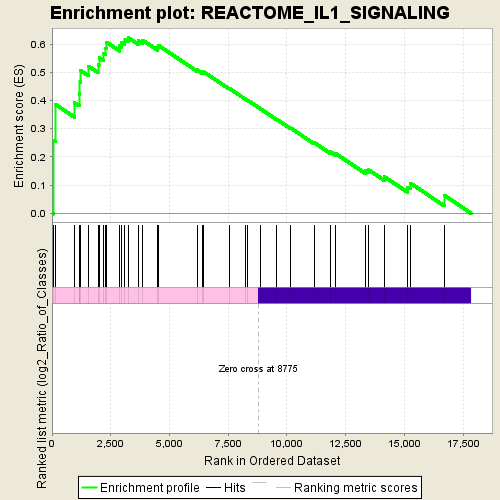
Profile of the Running ES Score & Positions of GeneSet Members on the Rank Ordered List
| Dataset | normalized_counts_per_kilobase_for_GSEA_2.class_2.cls #AHRR-overexpressed_versus_Control |
| Phenotype | class_2.cls#AHRR-overexpressed_versus_Control |
| Upregulated in class | AHRR-overexpressed |
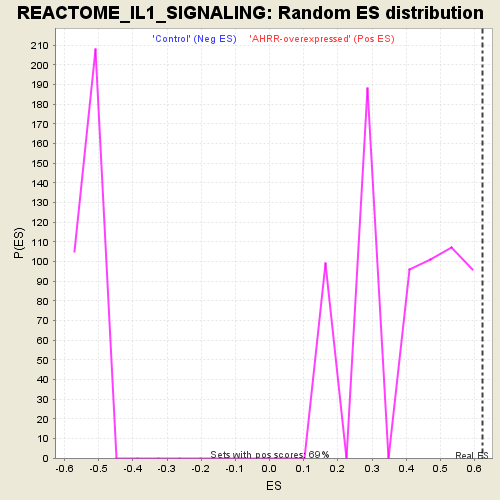
| GeneSet | REACTOME_IL1_SIGNALING |
| Enrichment Score (ES) | 0.62316513 |
| Normalized Enrichment Score (NES) | 1.6155926 |
| Nominal p-value | 0.0 |
| FDR q-value | 0.19924131 |
| FWER p-Value | 0.491 |
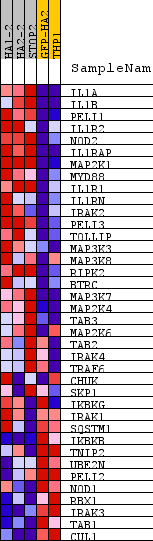
| PROBE | DESCRIPTION (from dataset) | GENE SYMBOL | GENE_TITLE | RANK IN GENE LIST | RANK METRIC SCORE | RUNNING ES | CORE ENRICHMENT | |
|---|---|---|---|---|---|---|---|---|
| 1 | IL1A | na | 49 | 5.421 | 0.2582 | Yes | ||
| 2 | IL1B | na | 148 | 2.766 | 0.3859 | Yes | ||
| 3 | PELI1 | na | 955 | 1.058 | 0.3916 | Yes | ||
| 4 | IL1R2 | na | 1155 | 0.911 | 0.4242 | Yes | ||
| 5 | NOD2 | na | 1188 | 0.892 | 0.4654 | Yes | ||
| 6 | IL1RAP | na | 1220 | 0.873 | 0.5057 | Yes | ||
| 7 | MAP2K1 | na | 1559 | 0.713 | 0.5210 | Yes | ||
| 8 | MYD88 | na | 1959 | 0.582 | 0.5266 | Yes | ||
| 9 | IL1R1 | na | 2000 | 0.567 | 0.5517 | Yes | ||
| 10 | IL1RN | na | 2178 | 0.523 | 0.5669 | Yes | ||
| 11 | IRAK2 | na | 2278 | 0.495 | 0.5852 | Yes | ||
| 12 | PELI3 | na | 2320 | 0.486 | 0.6063 | Yes | ||
| 13 | TOLLIP | na | 2878 | 0.380 | 0.5933 | Yes | ||
| 14 | MAP3K3 | na | 2970 | 0.365 | 0.6057 | Yes | ||
| 15 | MAP3K8 | na | 3104 | 0.344 | 0.6148 | Yes | ||
| 16 | RIPK2 | na | 3235 | 0.325 | 0.6232 | Yes | ||
| 17 | BTRC | na | 3679 | 0.273 | 0.6114 | No | ||
| 18 | MAP3K7 | na | 3858 | 0.255 | 0.6137 | No | ||
| 19 | MAP2K4 | na | 4491 | 0.202 | 0.5879 | No | ||
| 20 | TAB3 | na | 4527 | 0.199 | 0.5956 | No | ||
| 21 | MAP2K6 | na | 6173 | 0.104 | 0.5082 | No | ||
| 22 | TAB2 | na | 6395 | 0.094 | 0.5003 | No | ||
| 23 | IRAK4 | na | 6437 | 0.092 | 0.5024 | No | ||
| 24 | TRAF6 | na | 7542 | 0.047 | 0.4427 | No | ||
| 25 | CHUK | na | 8229 | 0.021 | 0.4052 | No | ||
| 26 | SKP1 | na | 8319 | 0.017 | 0.4010 | No | ||
| 27 | IKBKG | na | 8880 | -0.005 | 0.3698 | No | ||
| 28 | IRAK1 | na | 9570 | -0.031 | 0.3326 | No | ||
| 29 | SQSTM1 | na | 10157 | -0.054 | 0.3023 | No | ||
| 30 | IKBKB | na | 11156 | -0.095 | 0.2508 | No | ||
| 31 | TNIP2 | na | 11837 | -0.126 | 0.2186 | No | ||
| 32 | UBE2N | na | 12074 | -0.137 | 0.2120 | No | ||
| 33 | PELI2 | na | 13335 | -0.211 | 0.1514 | No | ||
| 34 | NOD1 | na | 13480 | -0.221 | 0.1539 | No | ||
| 35 | RBX1 | na | 14145 | -0.277 | 0.1300 | No | ||
| 36 | IRAK3 | na | 15147 | -0.399 | 0.0929 | No | ||
| 37 | TAB1 | na | 15270 | -0.418 | 0.1062 | No | ||
| 38 | CUL1 | na | 16697 | -0.792 | 0.0643 | No |