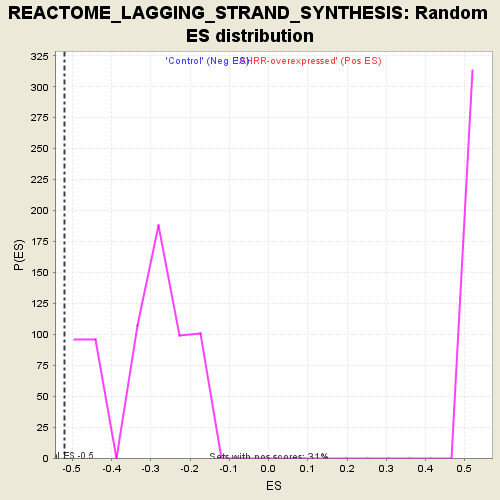
Profile of the Running ES Score & Positions of GeneSet Members on the Rank Ordered List
| Dataset | normalized_counts_per_kilobase_for_GSEA_2.class_2.cls #AHRR-overexpressed_versus_Control |
| Phenotype | class_2.cls#AHRR-overexpressed_versus_Control |
| Upregulated in class | Control |
| GeneSet | REACTOME_LAGGING_STRAND_SYNTHESIS |
| Enrichment Score (ES) | -0.5203526 |
| Normalized Enrichment Score (NES) | -1.6105728 |
| Nominal p-value | 0.0 |
| FDR q-value | 0.8151468 |
| FWER p-Value | 0.801 |
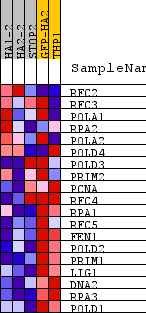
| PROBE | DESCRIPTION (from dataset) | GENE SYMBOL | GENE_TITLE | RANK IN GENE LIST | RANK METRIC SCORE | RUNNING ES | CORE ENRICHMENT | |
|---|---|---|---|---|---|---|---|---|
| 1 | RFC2 | na | 6913 | 0.071 | -0.3632 | No | ||
| 2 | RFC3 | na | 7865 | 0.034 | -0.4047 | No | ||
| 3 | POLA1 | na | 8394 | 0.014 | -0.4294 | No | ||
| 4 | RPA2 | na | 8398 | 0.014 | -0.4247 | No | ||
| 5 | POLA2 | na | 8491 | 0.011 | -0.4262 | No | ||
| 6 | POLD4 | na | 9774 | -0.039 | -0.4845 | No | ||
| 7 | POLD3 | na | 9942 | -0.046 | -0.4781 | No | ||
| 8 | PRIM2 | na | 10559 | -0.070 | -0.4885 | Yes | ||
| 9 | PCNA | na | 11127 | -0.093 | -0.4881 | Yes | ||
| 10 | RFC4 | na | 11359 | -0.104 | -0.4650 | Yes | ||
| 11 | RPA1 | na | 12156 | -0.142 | -0.4606 | Yes | ||
| 12 | RFC5 | na | 12490 | -0.160 | -0.4237 | Yes | ||
| 13 | FEN1 | na | 13484 | -0.222 | -0.4025 | Yes | ||
| 14 | POLD2 | na | 14064 | -0.270 | -0.3411 | Yes | ||
| 15 | PRIM1 | na | 14247 | -0.287 | -0.2519 | Yes | ||
| 16 | LIG1 | na | 14442 | -0.308 | -0.1557 | Yes | ||
| 17 | DNA2 | na | 14447 | -0.309 | -0.0486 | Yes | ||
| 18 | RPA3 | na | 14591 | -0.326 | 0.0564 | Yes | ||
| 19 | POLD1 | na | 14892 | -0.363 | 0.1655 | Yes |