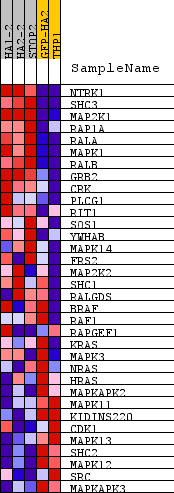
Profile of the Running ES Score & Positions of GeneSet Members on the Rank Ordered List
| Dataset | normalized_counts_per_kilobase_for_GSEA_2.class_2.cls #AHRR-overexpressed_versus_Control |
| Phenotype | class_2.cls#AHRR-overexpressed_versus_Control |
| Upregulated in class | AHRR-overexpressed |
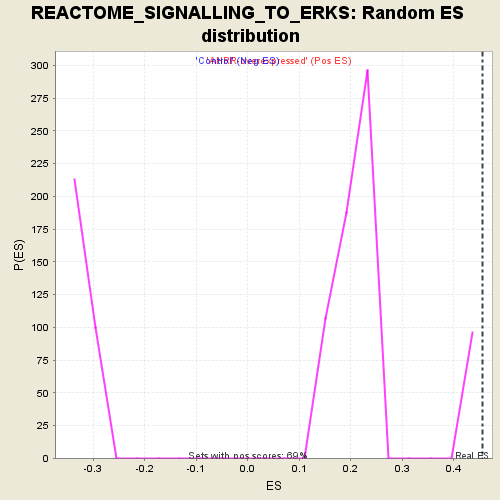
| GeneSet | REACTOME_SIGNALLING_TO_ERKS |
| Enrichment Score (ES) | 0.45560127 |
| Normalized Enrichment Score (NES) | 1.8789238 |
| Nominal p-value | 0.0 |
| FDR q-value | 0.32275495 |
| FWER p-Value | 0.101 |
| PROBE | DESCRIPTION (from dataset) | GENE SYMBOL | GENE_TITLE | RANK IN GENE LIST | RANK METRIC SCORE | RUNNING ES | CORE ENRICHMENT | |
|---|---|---|---|---|---|---|---|---|
| 1 | NTRK1 | na | 131 | 2.985 | 0.2624 | Yes | ||
| 2 | SHC3 | na | 246 | 2.209 | 0.4556 | Yes | ||
| 3 | MAP2K1 | na | 1559 | 0.713 | 0.4464 | No | ||
| 4 | RAP1A | na | 3645 | 0.275 | 0.3542 | No | ||
| 5 | RALA | na | 4176 | 0.227 | 0.3449 | No | ||
| 6 | MAPK1 | na | 4266 | 0.219 | 0.3597 | No | ||
| 7 | RALB | na | 4929 | 0.170 | 0.3379 | No | ||
| 8 | GRB2 | na | 4985 | 0.166 | 0.3498 | No | ||
| 9 | CRK | na | 5079 | 0.162 | 0.3592 | No | ||
| 10 | PLCG1 | na | 5287 | 0.149 | 0.3611 | No | ||
| 11 | RIT1 | na | 5595 | 0.134 | 0.3560 | No | ||
| 12 | SOS1 | na | 5811 | 0.122 | 0.3550 | No | ||
| 13 | YWHAB | na | 6221 | 0.102 | 0.3412 | No | ||
| 14 | MAPK14 | na | 6344 | 0.097 | 0.3431 | No | ||
| 15 | FRS2 | na | 6392 | 0.094 | 0.3490 | No | ||
| 16 | MAP2K2 | na | 6878 | 0.073 | 0.3284 | No | ||
| 17 | SHC1 | na | 7644 | 0.042 | 0.2893 | No | ||
| 18 | RALGDS | na | 7841 | 0.035 | 0.2814 | No | ||
| 19 | BRAF | na | 8093 | 0.026 | 0.2696 | No | ||
| 20 | RAF1 | na | 8761 | 0.000 | 0.2322 | No | ||
| 21 | RAPGEF1 | na | 9036 | -0.010 | 0.2177 | No | ||
| 22 | KRAS | na | 9191 | -0.016 | 0.2105 | No | ||
| 23 | MAPK3 | na | 9820 | -0.041 | 0.1789 | No | ||
| 24 | NRAS | na | 9998 | -0.048 | 0.1733 | No | ||
| 25 | HRAS | na | 11793 | -0.124 | 0.0838 | No | ||
| 26 | MAPKAPK2 | na | 12125 | -0.140 | 0.0778 | No | ||
| 27 | MAPK11 | na | 12162 | -0.142 | 0.0886 | No | ||
| 28 | KIDINS220 | na | 12664 | -0.169 | 0.0758 | No | ||
| 29 | CDK1 | na | 13099 | -0.196 | 0.0691 | No | ||
| 30 | MAPK13 | na | 15066 | -0.387 | -0.0063 | No | ||
| 31 | SHC2 | na | 15132 | -0.397 | 0.0259 | No | ||
| 32 | MAPK12 | na | 15148 | -0.400 | 0.0612 | No | ||
| 33 | SRC | na | 15318 | -0.427 | 0.0903 | No | ||
| 34 | MAPKAPK3 | na | 16017 | -0.568 | 0.1024 | No |