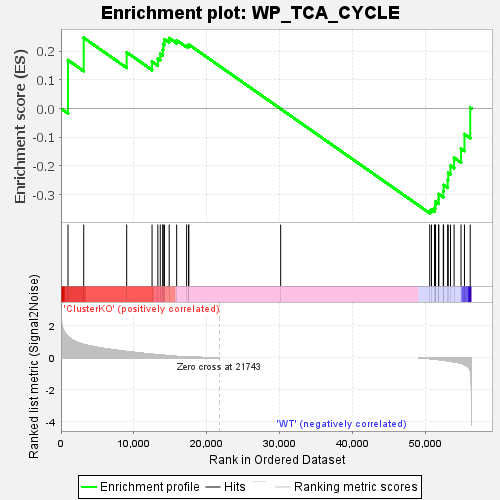
Profile of the Running ES Score & Positions of GeneSet Members on the Rank Ordered List
| Dataset | RPKM_matrix___ClusterKO_vs_WT.RPKM_matrix___ClusterKO_vs_WT.cls #ClusterKO_versus_WT |
| Phenotype | RPKM_matrix___ClusterKO_vs_WT.cls#ClusterKO_versus_WT |
| Upregulated in class | WT |
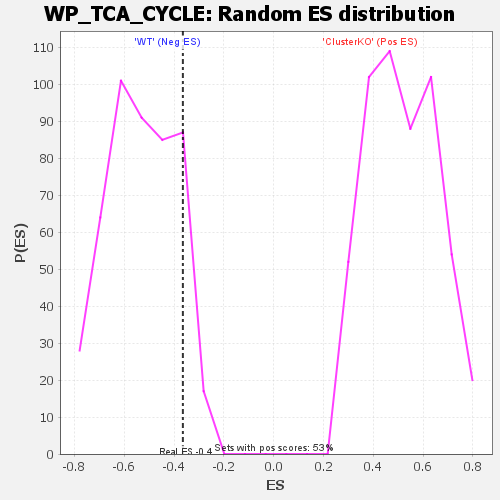
| GeneSet | WP_TCA_CYCLE |
| Enrichment Score (ES) | -0.3644537 |
| Normalized Enrichment Score (NES) | -0.6896851 |
| Nominal p-value | 0.8752643 |
| FDR q-value | 0.8842083 |
| FWER p-Value | 1.0 |
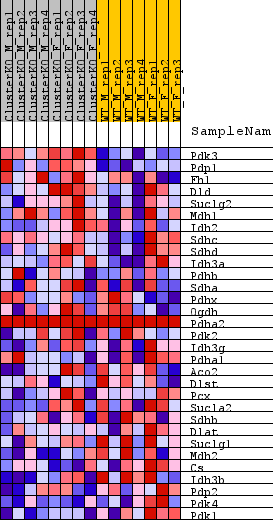
| SYMBOL | TITLE | RANK IN GENE LIST | RANK METRIC SCORE | RUNNING ES | CORE ENRICHMENT | |
|---|---|---|---|---|---|---|
| 1 | Pdk3 | na | 960 | 1.324 | 0.1686 | No |
| 2 | Pdp1 | na | 3119 | 0.828 | 0.2464 | No |
| 3 | Fh1 | na | 9022 | 0.386 | 0.1958 | No |
| 4 | Dld | na | 12505 | 0.210 | 0.1634 | No |
| 5 | Suclg2 | na | 13300 | 0.176 | 0.1739 | No |
| 6 | Mdh1 | na | 13634 | 0.162 | 0.1907 | No |
| 7 | Idh2 | na | 13972 | 0.148 | 0.2054 | No |
| 8 | Sdhc | na | 14038 | 0.146 | 0.2247 | No |
| 9 | Sdhd | na | 14207 | 0.139 | 0.2412 | No |
| 10 | Idh3a | na | 14859 | 0.111 | 0.2452 | No |
| 11 | Pdhb | na | 15887 | 0.076 | 0.2377 | No |
| 12 | Sdha | na | 17252 | 0.038 | 0.2188 | No |
| 13 | Pdhx | na | 17528 | 0.033 | 0.2186 | No |
| 14 | Ogdh | na | 17548 | 0.033 | 0.2229 | No |
| 15 | Pdha2 | na | 30171 | 0.000 | -0.0011 | No |
| 16 | Pdk2 | na | 50646 | -0.056 | -0.3566 | Yes |
| 17 | Idh3g | na | 50882 | -0.067 | -0.3514 | Yes |
| 18 | Pdha1 | na | 51304 | -0.087 | -0.3466 | Yes |
| 19 | Aco2 | na | 51412 | -0.093 | -0.3355 | Yes |
| 20 | Dlst | na | 51442 | -0.094 | -0.3228 | Yes |
| 21 | Pcx | na | 51871 | -0.117 | -0.3141 | Yes |
| 22 | Sucla2 | na | 51877 | -0.117 | -0.2977 | Yes |
| 23 | Sdhb | na | 52503 | -0.154 | -0.2872 | Yes |
| 24 | Dlat | na | 52547 | -0.156 | -0.2661 | Yes |
| 25 | Suclg1 | na | 53104 | -0.189 | -0.2494 | Yes |
| 26 | Mdh2 | na | 53185 | -0.194 | -0.2236 | Yes |
| 27 | Cs | na | 53495 | -0.217 | -0.1987 | Yes |
| 28 | Idh3b | na | 53989 | -0.258 | -0.1712 | Yes |
| 29 | Pdp2 | na | 54942 | -0.346 | -0.1395 | Yes |
| 30 | Pdk4 | na | 55413 | -0.420 | -0.0890 | Yes |
| 31 | Pdk1 | na | 56205 | -0.757 | 0.0031 | Yes |