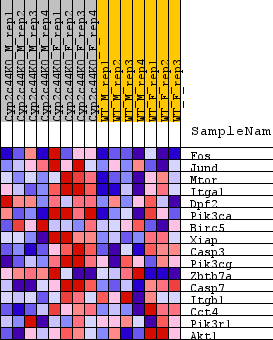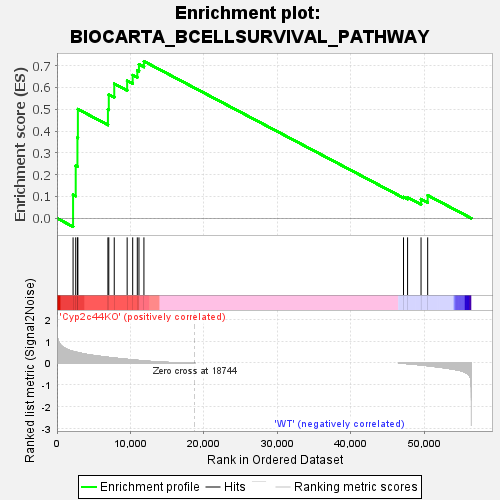
Profile of the Running ES Score & Positions of GeneSet Members on the Rank Ordered List
| Dataset | RPKM_matrix___Cyp2c44KO_vs_WT.RPKM_matrix___Cyp2c44KO_vs_WT.cls #Cyp2c44KO_versus_WT |
| Phenotype | RPKM_matrix___Cyp2c44KO_vs_WT.cls#Cyp2c44KO_versus_WT |
| Upregulated in class | Cyp2c44KO |
| GeneSet | BIOCARTA_BCELLSURVIVAL_PATHWAY |
| Enrichment Score (ES) | 0.7201013 |
| Normalized Enrichment Score (NES) | 1.3244882 |
| Nominal p-value | 0.04288499 |
| FDR q-value | 0.89309144 |
| FWER p-Value | 0.592 |
| SYMBOL | TITLE | RANK IN GENE LIST | RANK METRIC SCORE | RUNNING ES | CORE ENRICHMENT | |
|---|---|---|---|---|---|---|
| 1 | Fos | na | 2187 | 0.529 | 0.1085 | Yes |
| 2 | Jund | na | 2547 | 0.498 | 0.2407 | Yes |
| 3 | Mtor | na | 2780 | 0.479 | 0.3697 | Yes |
| 4 | Itga1 | na | 2841 | 0.474 | 0.5005 | Yes |
| 5 | Dpf2 | na | 6930 | 0.257 | 0.4995 | Yes |
| 6 | Pik3ca | na | 7048 | 0.252 | 0.5676 | Yes |
| 7 | Birc5 | na | 7790 | 0.225 | 0.6170 | Yes |
| 8 | Xiap | na | 9546 | 0.163 | 0.6313 | Yes |
| 9 | Casp3 | na | 10300 | 0.138 | 0.6564 | Yes |
| 10 | Pik3cg | na | 10927 | 0.120 | 0.6785 | Yes |
| 11 | Zbtb7a | na | 11153 | 0.113 | 0.7060 | Yes |
| 12 | Casp7 | na | 11829 | 0.094 | 0.7201 | Yes |
| 13 | Itgb1 | na | 47154 | -0.015 | 0.0975 | No |
| 14 | Cct4 | na | 47708 | -0.028 | 0.0957 | No |
| 15 | Pik3r1 | na | 49539 | -0.088 | 0.0877 | No |
| 16 | Akt1 | na | 50442 | -0.121 | 0.1053 | No |