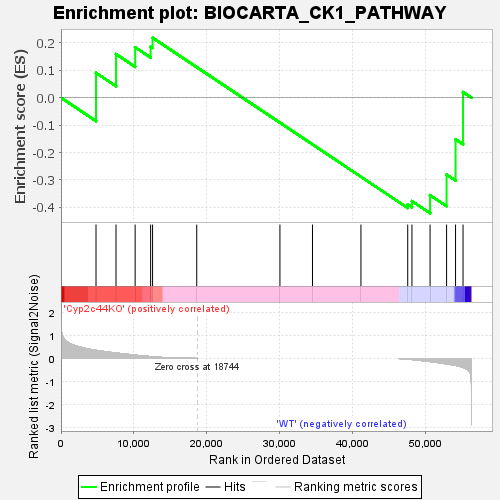
Profile of the Running ES Score & Positions of GeneSet Members on the Rank Ordered List
| Dataset | RPKM_matrix___Cyp2c44KO_vs_WT.RPKM_matrix___Cyp2c44KO_vs_WT.cls #Cyp2c44KO_versus_WT |
| Phenotype | RPKM_matrix___Cyp2c44KO_vs_WT.cls#Cyp2c44KO_versus_WT |
| Upregulated in class | WT |
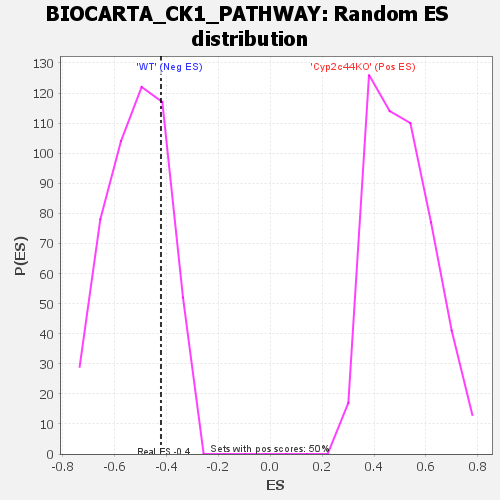
| GeneSet | BIOCARTA_CK1_PATHWAY |
| Enrichment Score (ES) | -0.42154807 |
| Normalized Enrichment Score (NES) | -0.816843 |
| Nominal p-value | 0.75697213 |
| FDR q-value | 1.0 |
| FWER p-Value | 0.99 |
| SYMBOL | TITLE | RANK IN GENE LIST | RANK METRIC SCORE | RUNNING ES | CORE ENRICHMENT | |
|---|---|---|---|---|---|---|
| 1 | Csnk1d | na | 4808 | 0.350 | 0.0909 | No |
| 2 | Prkar1a | na | 7556 | 0.233 | 0.1593 | No |
| 3 | Ppp3ca | na | 10182 | 0.142 | 0.1842 | No |
| 4 | Prkacb | na | 12310 | 0.080 | 0.1867 | No |
| 5 | Cdk5 | na | 12578 | 0.073 | 0.2189 | No |
| 6 | Cdk5r1 | na | 18643 | 0.001 | 0.1116 | No |
| 7 | Grm1 | na | 30068 | 0.000 | -0.0911 | No |
| 8 | Drd1 | na | 34540 | 0.000 | -0.1704 | No |
| 9 | Drd2 | na | 41196 | 0.000 | -0.2885 | No |
| 10 | Prkar1b | na | 47620 | -0.027 | -0.3891 | Yes |
| 11 | Ppp2ca | na | 48202 | -0.044 | -0.3774 | Yes |
| 12 | Prkar2b | na | 50689 | -0.131 | -0.3557 | Yes |
| 13 | Ppp1r1b | na | 52958 | -0.230 | -0.2804 | Yes |
| 14 | Prkar2a | na | 54189 | -0.300 | -0.1517 | Yes |
| 15 | Plcb1 | na | 55217 | -0.379 | 0.0206 | Yes |