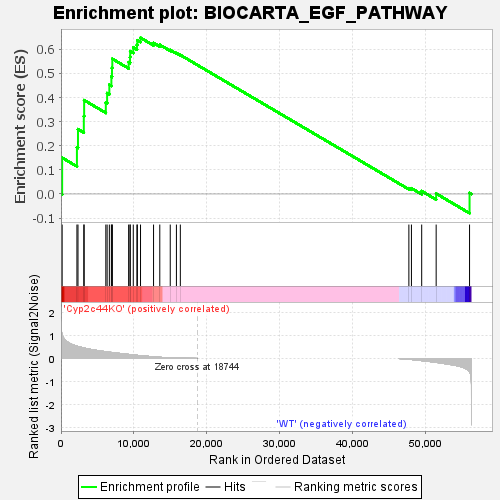
Profile of the Running ES Score & Positions of GeneSet Members on the Rank Ordered List
| Dataset | RPKM_matrix___Cyp2c44KO_vs_WT.RPKM_matrix___Cyp2c44KO_vs_WT.cls #Cyp2c44KO_versus_WT |
| Phenotype | RPKM_matrix___Cyp2c44KO_vs_WT.cls#Cyp2c44KO_versus_WT |
| Upregulated in class | Cyp2c44KO |
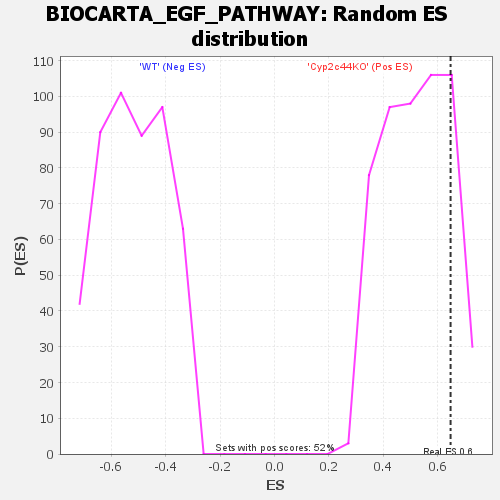
| GeneSet | BIOCARTA_EGF_PATHWAY |
| Enrichment Score (ES) | 0.64754045 |
| Normalized Enrichment Score (NES) | 1.2459164 |
| Nominal p-value | 0.16023166 |
| FDR q-value | 0.53170913 |
| FWER p-Value | 0.713 |
| SYMBOL | TITLE | RANK IN GENE LIST | RANK METRIC SCORE | RUNNING ES | CORE ENRICHMENT | |
|---|---|---|---|---|---|---|
| 1 | Jun | na | 157 | 1.020 | 0.1502 | Yes |
| 2 | Fos | na | 2187 | 0.529 | 0.1936 | Yes |
| 3 | Elk1 | na | 2333 | 0.517 | 0.2686 | Yes |
| 4 | Egf | na | 3134 | 0.452 | 0.3222 | Yes |
| 5 | Rasa1 | na | 3179 | 0.449 | 0.3888 | Yes |
| 6 | Prkcb | na | 6156 | 0.288 | 0.3792 | Yes |
| 7 | Csnk2a2 | na | 6335 | 0.280 | 0.4181 | Yes |
| 8 | Plcg1 | na | 6640 | 0.268 | 0.4528 | Yes |
| 9 | Mapk8 | na | 6919 | 0.258 | 0.4865 | Yes |
| 10 | Sos1 | na | 7003 | 0.254 | 0.5232 | Yes |
| 11 | Pik3ca | na | 7048 | 0.252 | 0.5602 | Yes |
| 12 | Map2k1 | na | 9289 | 0.172 | 0.5463 | Yes |
| 13 | Csnk2a1 | na | 9481 | 0.166 | 0.5677 | Yes |
| 14 | Mapk3 | na | 9505 | 0.165 | 0.5920 | Yes |
| 15 | Map2k4 | na | 9927 | 0.151 | 0.6071 | Yes |
| 16 | Stat5a | na | 10430 | 0.134 | 0.6184 | Yes |
| 17 | Stat1 | na | 10488 | 0.133 | 0.6373 | Yes |
| 18 | Jak1 | na | 10922 | 0.120 | 0.6475 | Yes |
| 19 | Prkca | na | 12711 | 0.069 | 0.6262 | No |
| 20 | Raf1 | na | 13568 | 0.049 | 0.6184 | No |
| 21 | Srf | na | 15004 | 0.025 | 0.5967 | No |
| 22 | Map3k1 | na | 15852 | 0.016 | 0.5840 | No |
| 23 | Stat3 | na | 16389 | 0.011 | 0.5762 | No |
| 24 | Grb2 | na | 47778 | -0.030 | 0.0238 | No |
| 25 | Shc1 | na | 48130 | -0.041 | 0.0237 | No |
| 26 | Pik3r1 | na | 49539 | -0.088 | 0.0119 | No |
| 27 | Egfr | na | 51526 | -0.166 | 0.0016 | No |
| 28 | Hras | na | 56113 | -0.564 | 0.0047 | No |