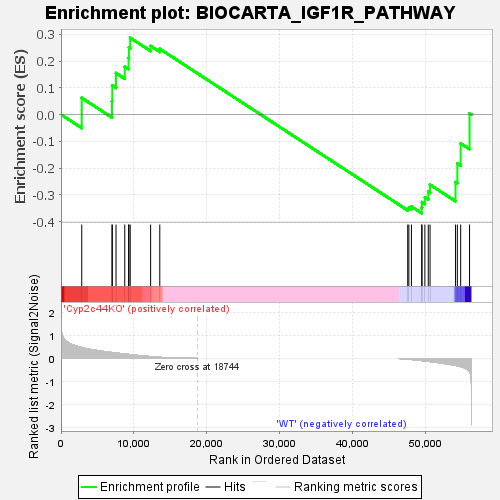
Profile of the Running ES Score & Positions of GeneSet Members on the Rank Ordered List
| Dataset | RPKM_matrix___Cyp2c44KO_vs_WT.RPKM_matrix___Cyp2c44KO_vs_WT.cls #Cyp2c44KO_versus_WT |
| Phenotype | RPKM_matrix___Cyp2c44KO_vs_WT.cls#Cyp2c44KO_versus_WT |
| Upregulated in class | WT |
| GeneSet | BIOCARTA_IGF1R_PATHWAY |
| Enrichment Score (ES) | -0.3690845 |
| Normalized Enrichment Score (NES) | -0.68497944 |
| Nominal p-value | 0.8962076 |
| FDR q-value | 0.8894651 |
| FWER p-Value | 0.996 |
| SYMBOL | TITLE | RANK IN GENE LIST | RANK METRIC SCORE | RUNNING ES | CORE ENRICHMENT | |
|---|---|---|---|---|---|---|
| 1 | Igf1r | na | 2850 | 0.473 | 0.0623 | No |
| 2 | Sos1 | na | 7003 | 0.254 | 0.0491 | No |
| 3 | Pik3ca | na | 7048 | 0.252 | 0.1085 | No |
| 4 | Prkar1a | na | 7556 | 0.233 | 0.1550 | No |
| 5 | Irs1 | na | 8758 | 0.191 | 0.1791 | No |
| 6 | Map2k1 | na | 9289 | 0.172 | 0.2108 | No |
| 7 | Mapk1 | na | 9328 | 0.171 | 0.2508 | No |
| 8 | Mapk3 | na | 9505 | 0.165 | 0.2869 | No |
| 9 | Prkacb | na | 12310 | 0.080 | 0.2563 | No |
| 10 | Raf1 | na | 13568 | 0.049 | 0.2457 | No |
| 11 | Prkar1b | na | 47620 | -0.027 | -0.3522 | Yes |
| 12 | Grb2 | na | 47778 | -0.030 | -0.3477 | Yes |
| 13 | Shc1 | na | 48130 | -0.041 | -0.3441 | Yes |
| 14 | Pik3r1 | na | 49539 | -0.088 | -0.3481 | Yes |
| 15 | Rps6ka1 | na | 49586 | -0.090 | -0.3274 | Yes |
| 16 | Adcy1 | na | 49977 | -0.104 | -0.3096 | Yes |
| 17 | Akt1 | na | 50442 | -0.121 | -0.2890 | Yes |
| 18 | Prkar2b | na | 50689 | -0.131 | -0.2622 | Yes |
| 19 | Prkar2a | na | 54189 | -0.300 | -0.2529 | Yes |
| 20 | Bad | na | 54437 | -0.313 | -0.1826 | Yes |
| 21 | Ywhah | na | 54894 | -0.347 | -0.1080 | Yes |
| 22 | Hras | na | 56113 | -0.564 | 0.0047 | Yes |

