Profile of the Running ES Score & Positions of GeneSet Members on the Rank Ordered List
| Dataset | RPKM_matrix___Cyp2c44KO_vs_WT.RPKM_matrix___Cyp2c44KO_vs_WT.cls #Cyp2c44KO_versus_WT |
| Phenotype | RPKM_matrix___Cyp2c44KO_vs_WT.cls#Cyp2c44KO_versus_WT |
| Upregulated in class | Cyp2c44KO |
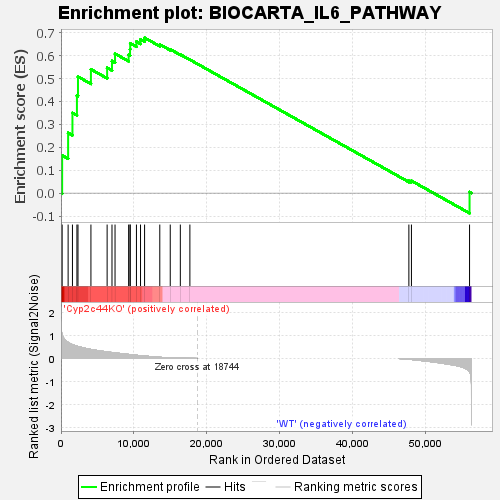
| GeneSet | BIOCARTA_IL6_PATHWAY |
| Enrichment Score (ES) | 0.6776669 |
| Normalized Enrichment Score (NES) | 1.3220761 |
| Nominal p-value | 0.067307696 |
| FDR q-value | 0.76340103 |
| FWER p-Value | 0.594 |
| SYMBOL | TITLE | RANK IN GENE LIST | RANK METRIC SCORE | RUNNING ES | CORE ENRICHMENT | |
|---|---|---|---|---|---|---|
| 1 | Jun | na | 157 | 1.020 | 0.1646 | Yes |
| 2 | Il6 | na | 978 | 0.687 | 0.2627 | Yes |
| 3 | Il6ra | na | 1572 | 0.595 | 0.3498 | Yes |
| 4 | Fos | na | 2187 | 0.529 | 0.4258 | Yes |
| 5 | Elk1 | na | 2333 | 0.517 | 0.5080 | Yes |
| 6 | Cebpb | na | 4110 | 0.388 | 0.5402 | Yes |
| 7 | Csnk2a2 | na | 6335 | 0.280 | 0.5467 | Yes |
| 8 | Sos1 | na | 7003 | 0.254 | 0.5765 | Yes |
| 9 | Jak2 | na | 7421 | 0.238 | 0.6082 | Yes |
| 10 | Map2k1 | na | 9289 | 0.172 | 0.6033 | Yes |
| 11 | Csnk2a1 | na | 9481 | 0.166 | 0.6271 | Yes |
| 12 | Mapk3 | na | 9505 | 0.165 | 0.6537 | Yes |
| 13 | Jak3 | na | 10361 | 0.136 | 0.6609 | Yes |
| 14 | Jak1 | na | 10922 | 0.120 | 0.6706 | Yes |
| 15 | Il6st | na | 11480 | 0.103 | 0.6777 | Yes |
| 16 | Raf1 | na | 13568 | 0.049 | 0.6487 | No |
| 17 | Srf | na | 15004 | 0.025 | 0.6274 | No |
| 18 | Stat3 | na | 16389 | 0.011 | 0.6047 | No |
| 19 | Ptpn11 | na | 17701 | 0.004 | 0.5820 | No |
| 20 | Grb2 | na | 47778 | -0.030 | 0.0533 | No |
| 21 | Shc1 | na | 48130 | -0.041 | 0.0539 | No |
| 22 | Hras | na | 56113 | -0.564 | 0.0047 | No |

