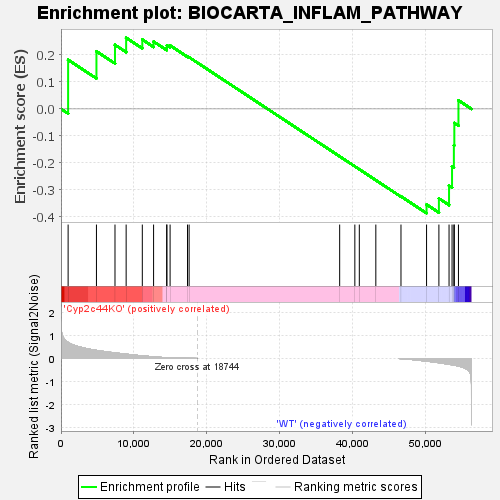
Profile of the Running ES Score & Positions of GeneSet Members on the Rank Ordered List
| Dataset | RPKM_matrix___Cyp2c44KO_vs_WT.RPKM_matrix___Cyp2c44KO_vs_WT.cls #Cyp2c44KO_versus_WT |
| Phenotype | RPKM_matrix___Cyp2c44KO_vs_WT.cls#Cyp2c44KO_versus_WT |
| Upregulated in class | WT |
| GeneSet | BIOCARTA_INFLAM_PATHWAY |
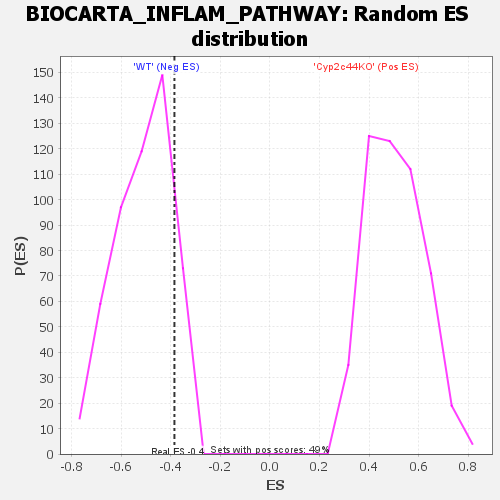
| Enrichment Score (ES) | -0.3860479 |
| Normalized Enrichment Score (NES) | -0.75244457 |
| Nominal p-value | 0.8767123 |
| FDR q-value | 0.9700652 |
| FWER p-Value | 0.995 |
| SYMBOL | TITLE | RANK IN GENE LIST | RANK METRIC SCORE | RUNNING ES | CORE ENRICHMENT | |
|---|---|---|---|---|---|---|
| 1 | Il6 | na | 978 | 0.687 | 0.1816 | No |
| 2 | Tgfb1 | na | 4868 | 0.347 | 0.2132 | No |
| 3 | Il1a | na | 7415 | 0.239 | 0.2372 | No |
| 4 | Pdgfa | na | 8947 | 0.184 | 0.2632 | No |
| 5 | Tgfb3 | na | 11167 | 0.113 | 0.2566 | No |
| 6 | Csf1 | na | 12716 | 0.069 | 0.2493 | No |
| 7 | Il4 | na | 14518 | 0.032 | 0.2265 | No |
| 8 | Ifnb1 | na | 14542 | 0.031 | 0.2352 | No |
| 9 | Il15 | na | 14983 | 0.025 | 0.2347 | No |
| 10 | Il13 | na | 17376 | 0.005 | 0.1938 | No |
| 11 | Il11 | na | 17596 | 0.004 | 0.1912 | No |
| 12 | Csf3 | na | 38274 | 0.000 | -0.1757 | No |
| 13 | Il5 | na | 40358 | 0.000 | -0.2127 | No |
| 14 | Ifna1 | na | 40972 | 0.000 | -0.2236 | No |
| 15 | Il3 | na | 43240 | 0.000 | -0.2638 | No |
| 16 | Ifng | na | 46694 | -0.005 | -0.3237 | No |
| 17 | Tnf | na | 50208 | -0.112 | -0.3537 | Yes |
| 18 | Tgfb2 | na | 51902 | -0.181 | -0.3312 | Yes |
| 19 | Il7 | na | 53296 | -0.249 | -0.2838 | Yes |
| 20 | Il2 | na | 53708 | -0.269 | -0.2130 | Yes |
| 21 | Cd4 | na | 53959 | -0.285 | -0.1347 | Yes |
| 22 | Csf2 | na | 54021 | -0.289 | -0.0521 | Yes |
| 23 | Il10 | na | 54588 | -0.324 | 0.0317 | Yes |