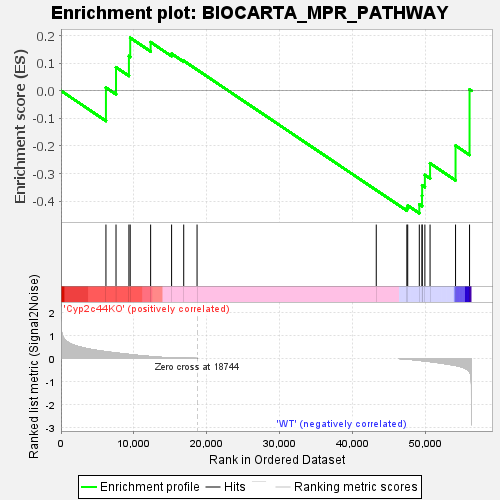
Profile of the Running ES Score & Positions of GeneSet Members on the Rank Ordered List
| Dataset | RPKM_matrix___Cyp2c44KO_vs_WT.RPKM_matrix___Cyp2c44KO_vs_WT.cls #Cyp2c44KO_versus_WT |
| Phenotype | RPKM_matrix___Cyp2c44KO_vs_WT.cls#Cyp2c44KO_versus_WT |
| Upregulated in class | WT |
| GeneSet | BIOCARTA_MPR_PATHWAY |
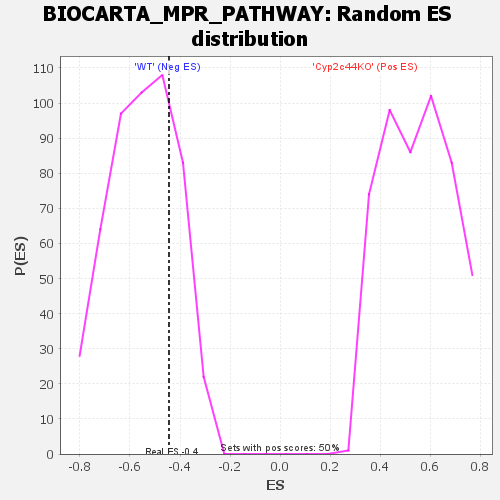
| Enrichment Score (ES) | -0.44411433 |
| Normalized Enrichment Score (NES) | -0.8076041 |
| Nominal p-value | 0.7504951 |
| FDR q-value | 1.0 |
| FWER p-Value | 0.99 |
| SYMBOL | TITLE | RANK IN GENE LIST | RANK METRIC SCORE | RUNNING ES | CORE ENRICHMENT | |
|---|---|---|---|---|---|---|
| 1 | Cdc25c | na | 6172 | 0.287 | 0.0115 | No |
| 2 | Prkar1a | na | 7556 | 0.233 | 0.0852 | No |
| 3 | Mapk1 | na | 9328 | 0.171 | 0.1257 | No |
| 4 | Mapk3 | na | 9505 | 0.165 | 0.1921 | No |
| 5 | Prkacb | na | 12310 | 0.080 | 0.1761 | No |
| 6 | Ccnb1 | na | 15190 | 0.023 | 0.1346 | No |
| 7 | Acta1 | na | 16854 | 0.008 | 0.1085 | No |
| 8 | Pgr | na | 18687 | 0.000 | 0.0762 | No |
| 9 | Myt1 | na | 43299 | 0.000 | -0.3605 | No |
| 10 | Cdk1 | na | 47502 | -0.024 | -0.4250 | Yes |
| 11 | Prkar1b | na | 47620 | -0.027 | -0.4159 | Yes |
| 12 | Cap1 | na | 49211 | -0.077 | -0.4119 | Yes |
| 13 | Rps6ka1 | na | 49586 | -0.090 | -0.3805 | Yes |
| 14 | Pin1 | na | 49603 | -0.090 | -0.3427 | Yes |
| 15 | Adcy1 | na | 49977 | -0.104 | -0.3055 | Yes |
| 16 | Prkar2b | na | 50689 | -0.131 | -0.2629 | Yes |
| 17 | Prkar2a | na | 54189 | -0.300 | -0.1987 | Yes |
| 18 | Hras | na | 56113 | -0.564 | 0.0047 | Yes |