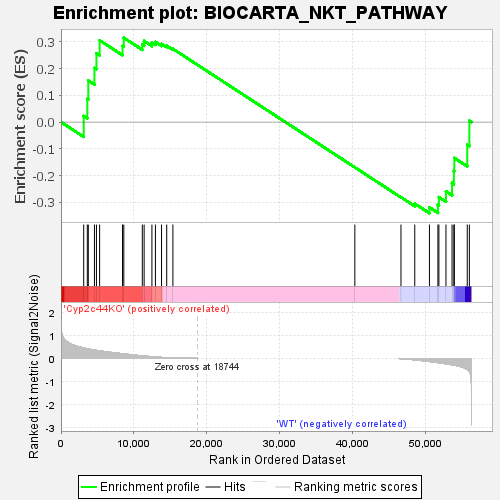
Profile of the Running ES Score & Positions of GeneSet Members on the Rank Ordered List
| Dataset | RPKM_matrix___Cyp2c44KO_vs_WT.RPKM_matrix___Cyp2c44KO_vs_WT.cls #Cyp2c44KO_versus_WT |
| Phenotype | RPKM_matrix___Cyp2c44KO_vs_WT.cls#Cyp2c44KO_versus_WT |
| Upregulated in class | WT |
| GeneSet | BIOCARTA_NKT_PATHWAY |
| Enrichment Score (ES) | -0.34105405 |
| Normalized Enrichment Score (NES) | -0.6972031 |
| Nominal p-value | 0.96737045 |
| FDR q-value | 0.93410254 |
| FWER p-Value | 0.996 |
| SYMBOL | TITLE | RANK IN GENE LIST | RANK METRIC SCORE | RUNNING ES | CORE ENRICHMENT | |
|---|---|---|---|---|---|---|
| 1 | Cxcr4 | na | 3118 | 0.454 | 0.0228 | No |
| 2 | Il12rb2 | na | 3612 | 0.421 | 0.0865 | No |
| 3 | Noct | na | 3750 | 0.412 | 0.1550 | No |
| 4 | Ccr7 | na | 4593 | 0.363 | 0.2026 | No |
| 5 | Tgfb1 | na | 4868 | 0.347 | 0.2575 | No |
| 6 | Ifngr2 | na | 5305 | 0.325 | 0.3059 | No |
| 7 | Ccr5 | na | 8448 | 0.202 | 0.2849 | No |
| 8 | Cd28 | na | 8627 | 0.195 | 0.3153 | No |
| 9 | Tgfb3 | na | 11167 | 0.113 | 0.2897 | No |
| 10 | Il12rb1 | na | 11418 | 0.105 | 0.3034 | No |
| 11 | Cxcr3 | na | 12487 | 0.075 | 0.2974 | No |
| 12 | Il4ra | na | 12969 | 0.063 | 0.2998 | No |
| 13 | Ifngr1 | na | 13808 | 0.044 | 0.2925 | No |
| 14 | Il4 | na | 14518 | 0.032 | 0.2854 | No |
| 15 | Il18r1 | na | 15369 | 0.021 | 0.2739 | No |
| 16 | Il5 | na | 40358 | 0.000 | -0.1695 | No |
| 17 | Ifng | na | 46694 | -0.005 | -0.2811 | No |
| 18 | Ccl3 | na | 48587 | -0.055 | -0.3053 | No |
| 19 | Ccr2 | na | 50603 | -0.127 | -0.3191 | Yes |
| 20 | Ccr1 | na | 51766 | -0.175 | -0.3096 | Yes |
| 21 | Tgfb2 | na | 51902 | -0.181 | -0.2808 | Yes |
| 22 | Ccl4 | na | 52873 | -0.225 | -0.2592 | Yes |
| 23 | Il2 | na | 53708 | -0.269 | -0.2276 | Yes |
| 24 | Cd4 | na | 53959 | -0.285 | -0.1829 | Yes |
| 25 | Csf2 | na | 54021 | -0.289 | -0.1343 | Yes |
| 26 | Ccr3 | na | 55797 | -0.470 | -0.0849 | Yes |
| 27 | Cd40lg | na | 56087 | -0.552 | 0.0051 | Yes |

