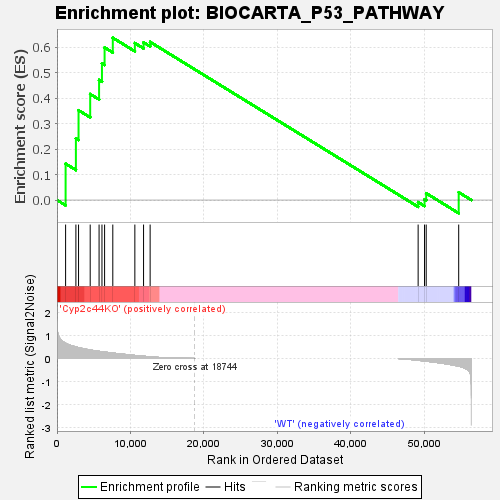
Profile of the Running ES Score & Positions of GeneSet Members on the Rank Ordered List
| Dataset | RPKM_matrix___Cyp2c44KO_vs_WT.RPKM_matrix___Cyp2c44KO_vs_WT.cls #Cyp2c44KO_versus_WT |
| Phenotype | RPKM_matrix___Cyp2c44KO_vs_WT.cls#Cyp2c44KO_versus_WT |
| Upregulated in class | Cyp2c44KO |
| GeneSet | BIOCARTA_P53_PATHWAY |
| Enrichment Score (ES) | 0.6366913 |
| Normalized Enrichment Score (NES) | 1.2851259 |
| Nominal p-value | 0.10685484 |
| FDR q-value | 0.53338957 |
| FWER p-Value | 0.654 |
| SYMBOL | TITLE | RANK IN GENE LIST | RANK METRIC SCORE | RUNNING ES | CORE ENRICHMENT | |
|---|---|---|---|---|---|---|
| 1 | Mdm2 | na | 1171 | 0.654 | 0.1427 | Yes |
| 2 | Cdk2 | na | 2571 | 0.496 | 0.2419 | Yes |
| 3 | Apaf1 | na | 2932 | 0.467 | 0.3523 | Yes |
| 4 | Cdkn1a | na | 4517 | 0.367 | 0.4158 | Yes |
| 5 | Bcl2 | na | 5726 | 0.307 | 0.4710 | Yes |
| 6 | Timp3 | na | 6118 | 0.289 | 0.5364 | Yes |
| 7 | Pcna | na | 6477 | 0.274 | 0.5986 | Yes |
| 8 | Rb1 | na | 7593 | 0.232 | 0.6367 | Yes |
| 9 | Bax | na | 10594 | 0.130 | 0.6158 | No |
| 10 | E2f1 | na | 11779 | 0.095 | 0.6185 | No |
| 11 | Trp53 | na | 12674 | 0.071 | 0.6203 | No |
| 12 | Ccnd1 | na | 49144 | -0.074 | -0.0083 | No |
| 13 | Ccne1 | na | 50014 | -0.105 | 0.0025 | No |
| 14 | Cdk4 | na | 50241 | -0.113 | 0.0267 | No |
| 15 | Gadd45a | na | 54664 | -0.329 | 0.0304 | No |

