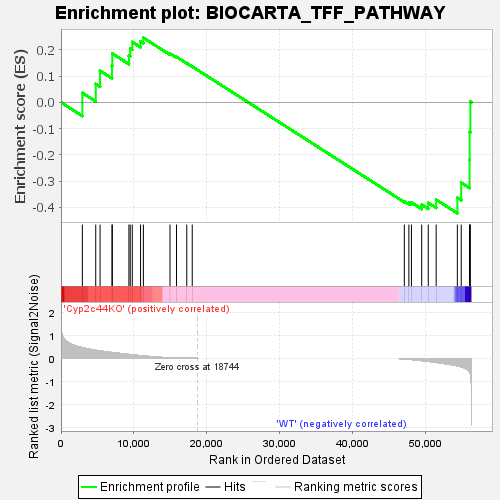
Profile of the Running ES Score & Positions of GeneSet Members on the Rank Ordered List
| Dataset | RPKM_matrix___Cyp2c44KO_vs_WT.RPKM_matrix___Cyp2c44KO_vs_WT.cls #Cyp2c44KO_versus_WT |
| Phenotype | RPKM_matrix___Cyp2c44KO_vs_WT.cls#Cyp2c44KO_versus_WT |
| Upregulated in class | WT |
| GeneSet | BIOCARTA_TFF_PATHWAY |
| Enrichment Score (ES) | -0.42245275 |
| Normalized Enrichment Score (NES) | -0.89779395 |
| Nominal p-value | 0.63286006 |
| FDR q-value | 1.0 |
| FWER p-Value | 0.972 |
| SYMBOL | TITLE | RANK IN GENE LIST | RANK METRIC SCORE | RUNNING ES | CORE ENRICHMENT | |
|---|---|---|---|---|---|---|
| 1 | Apaf1 | na | 2932 | 0.467 | 0.0361 | No |
| 2 | Erbb2 | na | 4771 | 0.352 | 0.0700 | No |
| 3 | Muc2 | na | 5365 | 0.323 | 0.1204 | No |
| 4 | Sos1 | na | 7003 | 0.254 | 0.1393 | No |
| 5 | Pik3ca | na | 7048 | 0.252 | 0.1861 | No |
| 6 | Mapk1 | na | 9328 | 0.171 | 0.1779 | No |
| 7 | Mapk3 | na | 9505 | 0.165 | 0.2059 | No |
| 8 | Ctnnb1 | na | 9789 | 0.155 | 0.2302 | No |
| 9 | Pik3cg | na | 10927 | 0.120 | 0.2325 | No |
| 10 | Ghr | na | 11314 | 0.109 | 0.2462 | No |
| 11 | Tff1 | na | 14968 | 0.026 | 0.1862 | No |
| 12 | Gh | na | 15865 | 0.015 | 0.1732 | No |
| 13 | Casp9 | na | 17273 | 0.006 | 0.1493 | No |
| 14 | Rhoa | na | 18024 | 0.003 | 0.1365 | No |
| 15 | Itgb1 | na | 47154 | -0.015 | -0.3776 | No |
| 16 | Grb2 | na | 47778 | -0.030 | -0.3829 | No |
| 17 | Shc1 | na | 48130 | -0.041 | -0.3813 | No |
| 18 | Pik3r1 | na | 49539 | -0.088 | -0.3897 | Yes |
| 19 | Akt1 | na | 50442 | -0.121 | -0.3829 | Yes |
| 20 | Egfr | na | 51526 | -0.166 | -0.3708 | Yes |
| 21 | Bad | na | 54437 | -0.313 | -0.3634 | Yes |
| 22 | Tff2 | na | 54969 | -0.354 | -0.3060 | Yes |
| 23 | Hras | na | 56113 | -0.564 | -0.2200 | Yes |
| 24 | Tff3 | na | 56120 | -0.565 | -0.1134 | Yes |
| 25 | Cycs | na | 56222 | -0.625 | 0.0028 | Yes |

