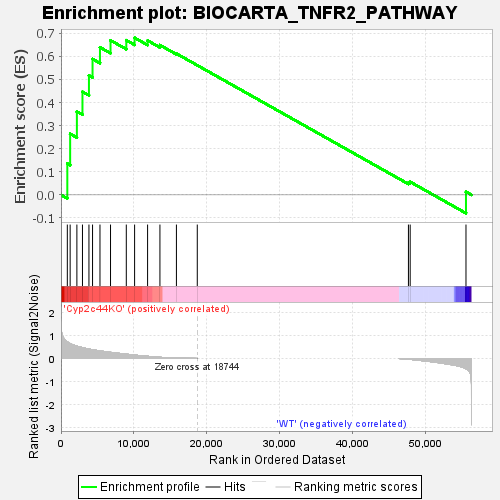
Profile of the Running ES Score & Positions of GeneSet Members on the Rank Ordered List
| Dataset | RPKM_matrix___Cyp2c44KO_vs_WT.RPKM_matrix___Cyp2c44KO_vs_WT.cls #Cyp2c44KO_versus_WT |
| Phenotype | RPKM_matrix___Cyp2c44KO_vs_WT.cls#Cyp2c44KO_versus_WT |
| Upregulated in class | Cyp2c44KO |
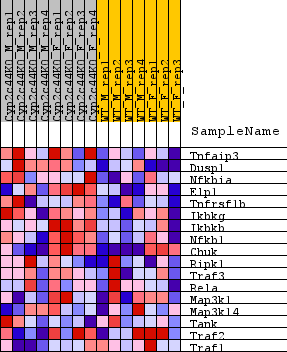
| GeneSet | BIOCARTA_TNFR2_PATHWAY |
| Enrichment Score (ES) | 0.6806929 |
| Normalized Enrichment Score (NES) | 1.2451249 |
| Nominal p-value | 0.16917293 |
| FDR q-value | 0.5084875 |
| FWER p-Value | 0.713 |
| SYMBOL | TITLE | RANK IN GENE LIST | RANK METRIC SCORE | RUNNING ES | CORE ENRICHMENT | |
|---|---|---|---|---|---|---|
| 1 | Tnfaip3 | na | 868 | 0.709 | 0.1357 | Yes |
| 2 | Dusp1 | na | 1257 | 0.637 | 0.2645 | Yes |
| 3 | Nfkbia | na | 2181 | 0.530 | 0.3609 | Yes |
| 4 | Elp1 | na | 2948 | 0.466 | 0.4467 | Yes |
| 5 | Tnfrsf1b | na | 3838 | 0.406 | 0.5174 | Yes |
| 6 | Ikbkg | na | 4333 | 0.376 | 0.5887 | Yes |
| 7 | Ikbkb | na | 5353 | 0.323 | 0.6395 | Yes |
| 8 | Nfkb1 | na | 6802 | 0.262 | 0.6696 | Yes |
| 9 | Chuk | na | 8968 | 0.183 | 0.6702 | Yes |
| 10 | Ripk1 | na | 10109 | 0.144 | 0.6807 | Yes |
| 11 | Traf3 | na | 11893 | 0.092 | 0.6687 | No |
| 12 | Rela | na | 13587 | 0.049 | 0.6490 | No |
| 13 | Map3k1 | na | 15852 | 0.016 | 0.6122 | No |
| 14 | Map3k14 | na | 18717 | 0.000 | 0.5614 | No |
| 15 | Tank | na | 47718 | -0.029 | 0.0530 | No |
| 16 | Traf2 | na | 47959 | -0.036 | 0.0564 | No |
| 17 | Traf1 | na | 55622 | -0.436 | 0.0134 | No |