Profile of the Running ES Score & Positions of GeneSet Members on the Rank Ordered List
| Dataset | RPKM_matrix___Cyp2c44KO_vs_WT.RPKM_matrix___Cyp2c44KO_vs_WT.cls #Cyp2c44KO_versus_WT |
| Phenotype | RPKM_matrix___Cyp2c44KO_vs_WT.cls#Cyp2c44KO_versus_WT |
| Upregulated in class | WT |
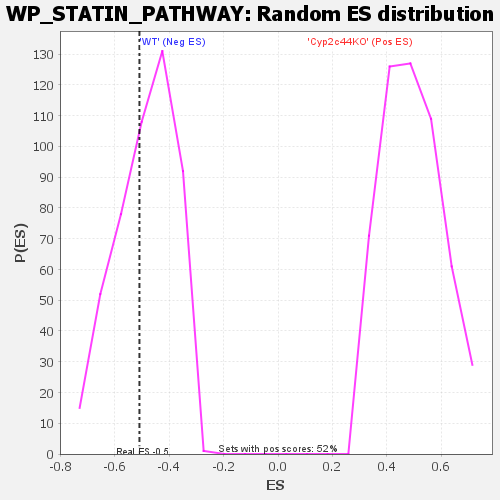
| GeneSet | WP_STATIN_PATHWAY |
| Enrichment Score (ES) | -0.50980055 |
| Normalized Enrichment Score (NES) | -1.0476835 |
| Nominal p-value | 0.38155136 |
| FDR q-value | 0.8336323 |
| FWER p-Value | 0.974 |
| SYMBOL | TITLE | RANK IN GENE LIST | RANK METRIC SCORE | RUNNING ES | CORE ENRICHMENT | |
|---|---|---|---|---|---|---|
| 1 | Apoc2 | na | 1385 | 0.619 | 0.0809 | No |
| 2 | Lpl | na | 3416 | 0.433 | 0.1186 | No |
| 3 | Soat1 | na | 3957 | 0.398 | 0.1768 | No |
| 4 | Lrp1 | na | 5639 | 0.311 | 0.1999 | No |
| 5 | Dgat1 | na | 8817 | 0.188 | 0.1756 | No |
| 6 | Cyp7a1 | na | 8961 | 0.183 | 0.2043 | No |
| 7 | Abca1 | na | 46926 | -0.010 | -0.4676 | No |
| 8 | Lipc | na | 49295 | -0.079 | -0.4961 | Yes |
| 9 | Scarb1 | na | 50068 | -0.107 | -0.4916 | Yes |
| 10 | Lcat | na | 50141 | -0.109 | -0.4742 | Yes |
| 11 | Pltp | na | 50878 | -0.139 | -0.4636 | Yes |
| 12 | Apoc1 | na | 51819 | -0.177 | -0.4501 | Yes |
| 13 | Apoe | na | 52207 | -0.195 | -0.4237 | Yes |
| 14 | Mttp | na | 52484 | -0.207 | -0.3933 | Yes |
| 15 | Ldlr | na | 54788 | -0.339 | -0.3765 | Yes |
| 16 | Apoa1 | na | 55759 | -0.462 | -0.3150 | Yes |
| 17 | Apoc3 | na | 55802 | -0.470 | -0.2356 | Yes |
| 18 | Hmgcr | na | 55988 | -0.517 | -0.1508 | Yes |
| 19 | Apoa4 | na | 56354 | -0.926 | 0.0004 | Yes |