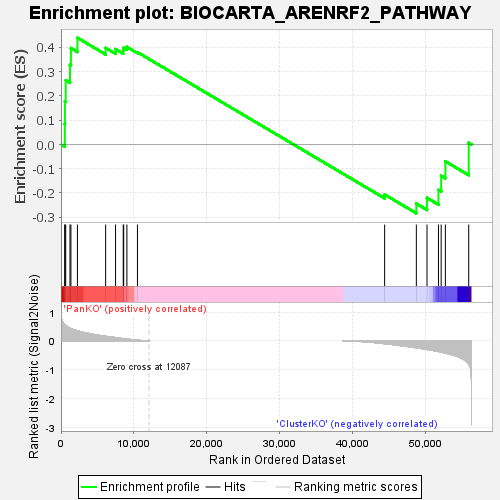
Profile of the Running ES Score & Positions of GeneSet Members on the Rank Ordered List
| Dataset | RPKM_matrix___PanKO_vs_ClusterKO.RPKM_matrix___PanKO_vs_ClusterKO.cls #PanKO_versus_ClusterKO |
| Phenotype | RPKM_matrix___PanKO_vs_ClusterKO.cls#PanKO_versus_ClusterKO |
| Upregulated in class | PanKO |
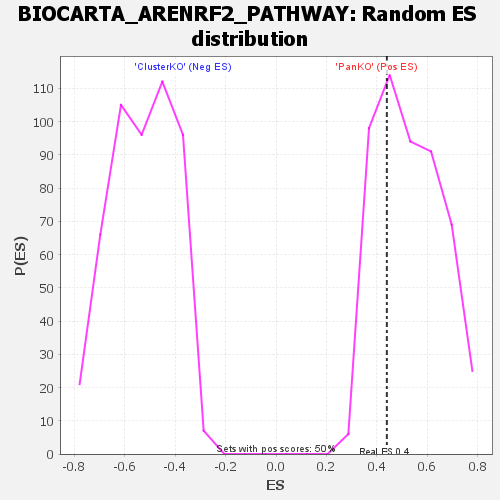
| GeneSet | BIOCARTA_ARENRF2_PATHWAY |
| Enrichment Score (ES) | 0.43991148 |
| Normalized Enrichment Score (NES) | 0.8334569 |
| Nominal p-value | 0.68209255 |
| FDR q-value | 1.0 |
| FWER p-Value | 0.952 |
| SYMBOL | TITLE | RANK IN GENE LIST | RANK METRIC SCORE | RUNNING ES | CORE ENRICHMENT | |
|---|---|---|---|---|---|---|
| 1 | Atf4 | na | 520 | 0.557 | 0.0846 | Yes |
| 2 | Maff | na | 539 | 0.553 | 0.1774 | Yes |
| 3 | Mafk | na | 644 | 0.530 | 0.2648 | Yes |
| 4 | Hmox1 | na | 1233 | 0.439 | 0.3283 | Yes |
| 5 | Jun | na | 1362 | 0.424 | 0.3975 | Yes |
| 6 | Fos | na | 2257 | 0.346 | 0.4399 | Yes |
| 7 | Nfe2l2 | na | 6131 | 0.160 | 0.3981 | No |
| 8 | Hmox2 | na | 7493 | 0.113 | 0.3929 | No |
| 9 | Por | na | 8547 | 0.079 | 0.3875 | No |
| 10 | Keap1 | na | 8611 | 0.077 | 0.3994 | No |
| 11 | Gsta2 | na | 9051 | 0.063 | 0.4022 | No |
| 12 | Mapk8 | na | 10501 | 0.023 | 0.3804 | No |
| 13 | Mafg | na | 44450 | -0.094 | -0.2062 | No |
| 14 | Prkca | na | 48804 | -0.235 | -0.2438 | No |
| 15 | Creb1 | na | 50269 | -0.294 | -0.2202 | No |
| 16 | Mapk14 | na | 51843 | -0.363 | -0.1870 | No |
| 17 | Cryz | na | 52214 | -0.382 | -0.1292 | No |
| 18 | Mapk1 | na | 52790 | -0.415 | -0.0695 | No |
| 19 | Prkcb | na | 55998 | -0.791 | 0.0067 | No |