Profile of the Running ES Score & Positions of GeneSet Members on the Rank Ordered List
| Dataset | RPKM_matrix___PanKO_vs_ClusterKO.RPKM_matrix___PanKO_vs_ClusterKO.cls #PanKO_versus_ClusterKO |
| Phenotype | RPKM_matrix___PanKO_vs_ClusterKO.cls#PanKO_versus_ClusterKO |
| Upregulated in class | PanKO |
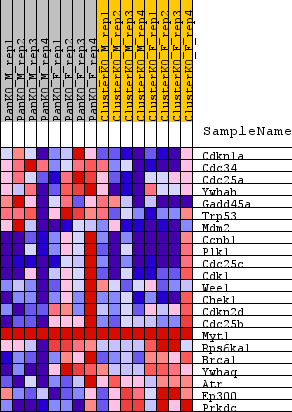
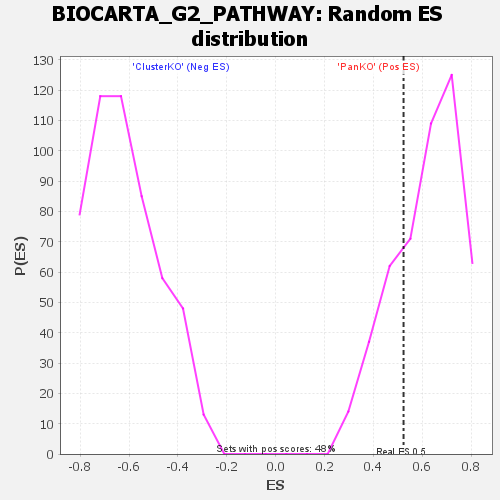
| GeneSet | BIOCARTA_G2_PATHWAY |
| Enrichment Score (ES) | 0.5232445 |
| Normalized Enrichment Score (NES) | 0.8487222 |
| Nominal p-value | 0.73388773 |
| FDR q-value | 1.0 |
| FWER p-Value | 0.95 |
| SYMBOL | TITLE | RANK IN GENE LIST | RANK METRIC SCORE | RUNNING ES | CORE ENRICHMENT | |
|---|---|---|---|---|---|---|
| 1 | Cdkn1a | na | 669 | 0.525 | 0.0753 | Yes |
| 2 | Cdc34 | na | 892 | 0.482 | 0.1515 | Yes |
| 3 | Cdc25a | na | 1224 | 0.440 | 0.2187 | Yes |
| 4 | Ywhah | na | 1540 | 0.406 | 0.2806 | Yes |
| 5 | Gadd45a | na | 1731 | 0.388 | 0.3417 | Yes |
| 6 | Trp53 | na | 1824 | 0.382 | 0.4035 | Yes |
| 7 | Mdm2 | na | 1925 | 0.372 | 0.4636 | Yes |
| 8 | Ccnb1 | na | 4315 | 0.231 | 0.4596 | Yes |
| 9 | Plk1 | na | 4661 | 0.216 | 0.4893 | Yes |
| 10 | Cdc25c | na | 5791 | 0.172 | 0.4980 | Yes |
| 11 | Cdk1 | na | 5933 | 0.167 | 0.5232 | Yes |
| 12 | Wee1 | na | 7386 | 0.116 | 0.5167 | No |
| 13 | Chek1 | na | 8048 | 0.093 | 0.5205 | No |
| 14 | Cdkn2d | na | 9603 | 0.047 | 0.5008 | No |
| 15 | Cdc25b | na | 11141 | 0.011 | 0.4753 | No |
| 16 | Myt1 | na | 23821 | 0.000 | 0.2504 | No |
| 17 | Rps6ka1 | na | 42312 | -0.038 | -0.0714 | No |
| 18 | Brca1 | na | 43356 | -0.063 | -0.0794 | No |
| 19 | Ywhaq | na | 47872 | -0.203 | -0.1259 | No |
| 20 | Atr | na | 52685 | -0.410 | -0.1431 | No |
| 21 | Ep300 | na | 52812 | -0.416 | -0.0762 | No |
| 22 | Prkdc | na | 56112 | -0.839 | 0.0047 | No |