Profile of the Running ES Score & Positions of GeneSet Members on the Rank Ordered List
| Dataset | RPKM_matrix___PanKO_vs_ClusterKO.RPKM_matrix___PanKO_vs_ClusterKO.cls #PanKO_versus_ClusterKO |
| Phenotype | RPKM_matrix___PanKO_vs_ClusterKO.cls#PanKO_versus_ClusterKO |
| Upregulated in class | ClusterKO |
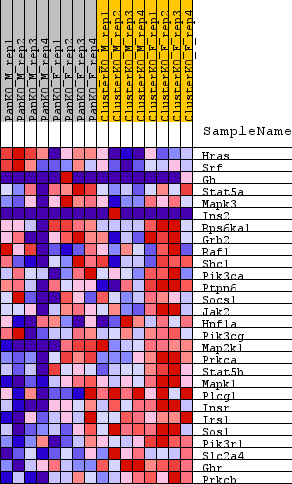
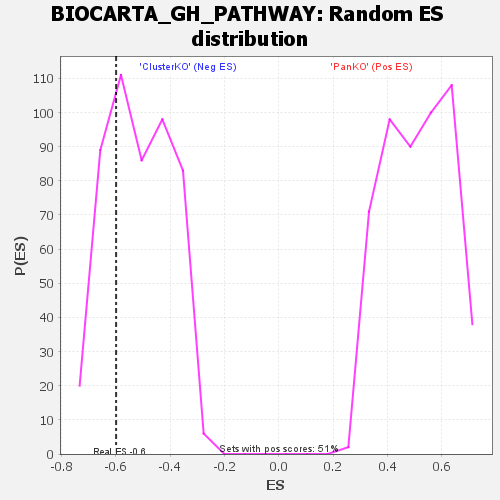
| GeneSet | BIOCARTA_GH_PATHWAY |
| Enrichment Score (ES) | -0.59925205 |
| Normalized Enrichment Score (NES) | -1.1598803 |
| Nominal p-value | 0.28600407 |
| FDR q-value | 0.7981256 |
| FWER p-Value | 0.763 |
| SYMBOL | TITLE | RANK IN GENE LIST | RANK METRIC SCORE | RUNNING ES | CORE ENRICHMENT | |
|---|---|---|---|---|---|---|
| 1 | Hras | na | 295 | 0.620 | 0.0682 | No |
| 2 | Srf | na | 1874 | 0.376 | 0.0847 | No |
| 3 | Gh | na | 4457 | 0.223 | 0.0653 | No |
| 4 | Stat5a | na | 5321 | 0.189 | 0.0724 | No |
| 5 | Mapk3 | na | 9547 | 0.049 | 0.0033 | No |
| 6 | Ins2 | na | 39346 | -0.003 | -0.5251 | No |
| 7 | Rps6ka1 | na | 42312 | -0.038 | -0.5732 | No |
| 8 | Grb2 | na | 42417 | -0.041 | -0.5702 | No |
| 9 | Raf1 | na | 42592 | -0.044 | -0.5681 | No |
| 10 | Shc1 | na | 43680 | -0.071 | -0.5789 | No |
| 11 | Pik3ca | na | 44386 | -0.092 | -0.5806 | No |
| 12 | Ptpn6 | na | 44887 | -0.107 | -0.5768 | No |
| 13 | Socs1 | na | 46155 | -0.146 | -0.5820 | Yes |
| 14 | Jak2 | na | 46694 | -0.163 | -0.5722 | Yes |
| 15 | Hnf1a | na | 47347 | -0.183 | -0.5621 | Yes |
| 16 | Pik3cg | na | 47489 | -0.189 | -0.5423 | Yes |
| 17 | Map2k1 | na | 48705 | -0.232 | -0.5365 | Yes |
| 18 | Prkca | na | 48804 | -0.235 | -0.5104 | Yes |
| 19 | Stat5b | na | 50983 | -0.324 | -0.5106 | Yes |
| 20 | Mapk1 | na | 52790 | -0.415 | -0.4936 | Yes |
| 21 | Plcg1 | na | 53295 | -0.447 | -0.4496 | Yes |
| 22 | Insr | na | 53757 | -0.478 | -0.4012 | Yes |
| 23 | Irs1 | na | 54082 | -0.502 | -0.3475 | Yes |
| 24 | Sos1 | na | 54092 | -0.503 | -0.2881 | Yes |
| 25 | Pik3r1 | na | 54770 | -0.569 | -0.2328 | Yes |
| 26 | Slc2a4 | na | 55401 | -0.651 | -0.1669 | Yes |
| 27 | Ghr | na | 55913 | -0.766 | -0.0854 | Yes |
| 28 | Prkcb | na | 55998 | -0.791 | 0.0067 | Yes |