Profile of the Running ES Score & Positions of GeneSet Members on the Rank Ordered List
| Dataset | RPKM_matrix___PanKO_vs_ClusterKO.RPKM_matrix___PanKO_vs_ClusterKO.cls #PanKO_versus_ClusterKO |
| Phenotype | RPKM_matrix___PanKO_vs_ClusterKO.cls#PanKO_versus_ClusterKO |
| Upregulated in class | PanKO |
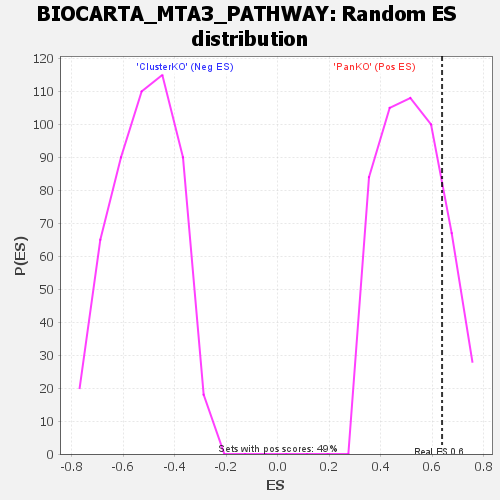
| GeneSet | BIOCARTA_MTA3_PATHWAY |
| Enrichment Score (ES) | 0.63822585 |
| Normalized Enrichment Score (NES) | 1.2203509 |
| Nominal p-value | 0.18495935 |
| FDR q-value | 1.0 |
| FWER p-Value | 0.692 |
| SYMBOL | TITLE | RANK IN GENE LIST | RANK METRIC SCORE | RUNNING ES | CORE ENRICHMENT | |
|---|---|---|---|---|---|---|
| 1 | Hspb1 | na | 302 | 0.618 | 0.1048 | Yes |
| 2 | Tuba1c | na | 340 | 0.605 | 0.2121 | Yes |
| 3 | Snai1 | na | 435 | 0.577 | 0.3133 | Yes |
| 4 | Aldoa | na | 1134 | 0.450 | 0.3812 | Yes |
| 5 | Cdh1 | na | 2290 | 0.344 | 0.4221 | Yes |
| 6 | Tuba4a | na | 2485 | 0.332 | 0.4778 | Yes |
| 7 | Tuba1b | na | 3103 | 0.292 | 0.5189 | Yes |
| 8 | Mbd3 | na | 3416 | 0.276 | 0.5625 | Yes |
| 9 | Tuba1a | na | 4114 | 0.241 | 0.5931 | Yes |
| 10 | Tuba8 | na | 5074 | 0.199 | 0.6115 | Yes |
| 11 | Gapdh | na | 5438 | 0.186 | 0.6382 | Yes |
| 12 | Pdzk1 | na | 8284 | 0.085 | 0.6028 | No |
| 13 | Ctsd | na | 10252 | 0.029 | 0.5731 | No |
| 14 | Greb1 | na | 11914 | 0.002 | 0.5440 | No |
| 15 | Mta1 | na | 44483 | -0.095 | -0.0169 | No |
| 16 | Mta3 | na | 45170 | -0.115 | -0.0085 | No |
| 17 | Esr1 | na | 47279 | -0.181 | -0.0137 | No |
| 18 | Hspb2 | na | 48988 | -0.242 | -0.0008 | No |
| 19 | Snai2 | na | 55814 | -0.739 | 0.0100 | No |