Profile of the Running ES Score & Positions of GeneSet Members on the Rank Ordered List
| Dataset | RPKM_matrix___PanKO_vs_ClusterKO.RPKM_matrix___PanKO_vs_ClusterKO.cls #PanKO_versus_ClusterKO |
| Phenotype | RPKM_matrix___PanKO_vs_ClusterKO.cls#PanKO_versus_ClusterKO |
| Upregulated in class | ClusterKO |
| GeneSet | BIOCARTA_NO2IL12_PATHWAY |
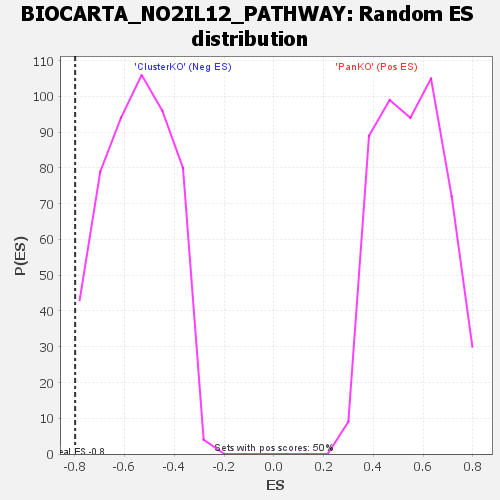
| Enrichment Score (ES) | -0.79799676 |
| Normalized Enrichment Score (NES) | -1.4503838 |
| Nominal p-value | 0.005976096 |
| FDR q-value | 0.5508984 |
| FWER p-Value | 0.239 |
| SYMBOL | TITLE | RANK IN GENE LIST | RANK METRIC SCORE | RUNNING ES | CORE ENRICHMENT | |
|---|---|---|---|---|---|---|
| 1 | Il12rb2 | na | 42173 | -0.035 | -0.7412 | No |
| 2 | Cd3g | na | 45374 | -0.121 | -0.7740 | Yes |
| 3 | Nos2 | na | 45476 | -0.124 | -0.7511 | Yes |
| 4 | Cxcr3 | na | 45786 | -0.134 | -0.7299 | Yes |
| 5 | Jak2 | na | 46694 | -0.163 | -0.7135 | Yes |
| 6 | Il12rb1 | na | 48489 | -0.224 | -0.7008 | Yes |
| 7 | Cd4 | na | 49182 | -0.250 | -0.6633 | Yes |
| 8 | Cd3e | na | 49243 | -0.253 | -0.6141 | Yes |
| 9 | Tyk2 | na | 51529 | -0.349 | -0.5853 | Yes |
| 10 | Ccr5 | na | 52545 | -0.401 | -0.5235 | Yes |
| 11 | Stat4 | na | 54285 | -0.520 | -0.4509 | Yes |
| 12 | Cd247 | na | 54418 | -0.532 | -0.3473 | Yes |
| 13 | Cd3d | na | 54545 | -0.545 | -0.2412 | Yes |
| 14 | Ifng | na | 55200 | -0.622 | -0.1290 | Yes |
| 15 | Cd2 | na | 55864 | -0.753 | 0.0091 | Yes |