Profile of the Running ES Score & Positions of GeneSet Members on the Rank Ordered List
| Dataset | RPKM_matrix___PanKO_vs_ClusterKO.RPKM_matrix___PanKO_vs_ClusterKO.cls #PanKO_versus_ClusterKO |
| Phenotype | RPKM_matrix___PanKO_vs_ClusterKO.cls#PanKO_versus_ClusterKO |
| Upregulated in class | ClusterKO |
| GeneSet | BIOCARTA_NUCLEARRS_PATHWAY |
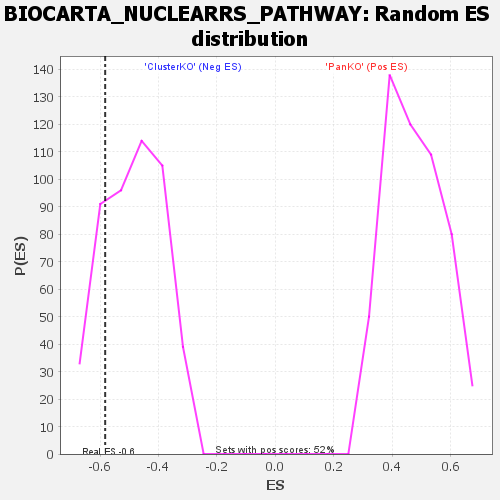
| Enrichment Score (ES) | -0.5824755 |
| Normalized Enrichment Score (NES) | -1.1992235 |
| Nominal p-value | 0.19665273 |
| FDR q-value | 0.86365163 |
| FWER p-Value | 0.721 |
| SYMBOL | TITLE | RANK IN GENE LIST | RANK METRIC SCORE | RUNNING ES | CORE ENRICHMENT | |
|---|---|---|---|---|---|---|
| 1 | Vdr | na | 1626 | 0.399 | 0.0118 | No |
| 2 | Nr0b2 | na | 3052 | 0.296 | 0.0166 | No |
| 3 | Pparg | na | 3656 | 0.264 | 0.0328 | No |
| 4 | Ppard | na | 4620 | 0.218 | 0.0379 | No |
| 5 | Abcd2 | na | 4972 | 0.203 | 0.0524 | No |
| 6 | Abcb1a | na | 5076 | 0.199 | 0.0708 | No |
| 7 | Rara | na | 6035 | 0.164 | 0.0705 | No |
| 8 | Cyp3a11 | na | 6248 | 0.155 | 0.0826 | No |
| 9 | Rarg | na | 8366 | 0.082 | 0.0533 | No |
| 10 | Nr1i2 | na | 9273 | 0.056 | 0.0430 | No |
| 11 | Cyp2c70 | na | 9445 | 0.051 | 0.0452 | No |
| 12 | Abcb1b | na | 9918 | 0.038 | 0.0407 | No |
| 13 | Cyp24a1 | na | 11323 | 0.009 | 0.0167 | No |
| 14 | Cyp27b1 | na | 40914 | -0.016 | -0.5068 | No |
| 15 | Nr1i3 | na | 42803 | -0.049 | -0.5353 | No |
| 16 | Cyp4a12b | na | 45039 | -0.112 | -0.5636 | Yes |
| 17 | Abcd3 | na | 45346 | -0.120 | -0.5568 | Yes |
| 18 | Abcb11 | na | 45421 | -0.122 | -0.5456 | Yes |
| 19 | Cyp8b1 | na | 45771 | -0.134 | -0.5382 | Yes |
| 20 | Nr1h4 | na | 45842 | -0.135 | -0.5256 | Yes |
| 21 | Cyp1a2 | na | 46967 | -0.172 | -0.5281 | Yes |
| 22 | Nr1h3 | na | 50034 | -0.284 | -0.5535 | Yes |
| 23 | Abcc3 | na | 50783 | -0.316 | -0.5346 | Yes |
| 24 | Abcc2 | na | 51497 | -0.347 | -0.5118 | Yes |
| 25 | Rarb | na | 52877 | -0.421 | -0.4935 | Yes |
| 26 | Abcg1 | na | 54764 | -0.568 | -0.4691 | Yes |
| 27 | Abcg5 | na | 54808 | -0.573 | -0.4114 | Yes |
| 28 | Cyp2e1 | na | 55206 | -0.623 | -0.3550 | Yes |
| 29 | Ppara | na | 55406 | -0.651 | -0.2921 | Yes |
| 30 | Abca1 | na | 55559 | -0.677 | -0.2258 | Yes |
| 31 | Cyp26a1 | na | 55970 | -0.782 | -0.1534 | Yes |
| 32 | Cyp4b1 | na | 56375 | -1.576 | 0.0000 | Yes |