Profile of the Running ES Score & Positions of GeneSet Members on the Rank Ordered List
| Dataset | RPKM_matrix___PanKO_vs_ClusterKO.RPKM_matrix___PanKO_vs_ClusterKO.cls #PanKO_versus_ClusterKO |
| Phenotype | RPKM_matrix___PanKO_vs_ClusterKO.cls#PanKO_versus_ClusterKO |
| Upregulated in class | PanKO |
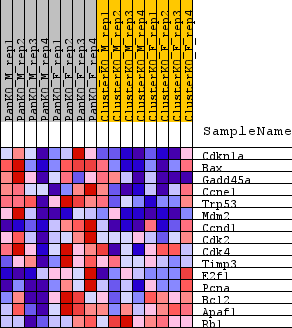
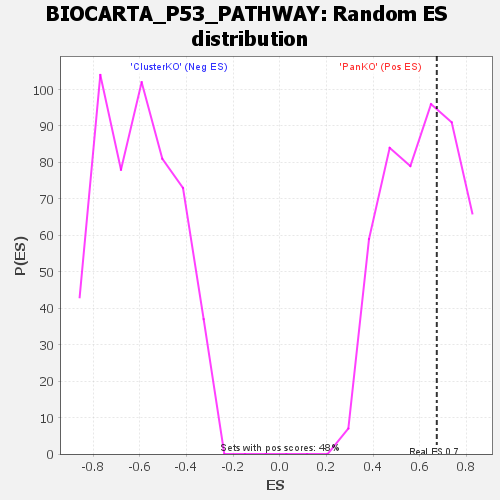
| GeneSet | BIOCARTA_P53_PATHWAY |
| Enrichment Score (ES) | 0.673108 |
| Normalized Enrichment Score (NES) | 1.1092414 |
| Nominal p-value | 0.37551868 |
| FDR q-value | 1.0 |
| FWER p-Value | 0.799 |
| SYMBOL | TITLE | RANK IN GENE LIST | RANK METRIC SCORE | RUNNING ES | CORE ENRICHMENT | |
|---|---|---|---|---|---|---|
| 1 | Cdkn1a | na | 669 | 0.525 | 0.1250 | Yes |
| 2 | Bax | na | 1298 | 0.431 | 0.2263 | Yes |
| 3 | Gadd45a | na | 1731 | 0.388 | 0.3199 | Yes |
| 4 | Ccne1 | na | 1795 | 0.383 | 0.4188 | Yes |
| 5 | Trp53 | na | 1824 | 0.382 | 0.5178 | Yes |
| 6 | Mdm2 | na | 1925 | 0.372 | 0.6129 | Yes |
| 7 | Ccnd1 | na | 4671 | 0.215 | 0.6204 | Yes |
| 8 | Cdk2 | na | 6111 | 0.161 | 0.6368 | Yes |
| 9 | Cdk4 | na | 7175 | 0.123 | 0.6499 | Yes |
| 10 | Timp3 | na | 7512 | 0.112 | 0.6731 | Yes |
| 11 | E2f1 | na | 8922 | 0.067 | 0.6656 | No |
| 12 | Pcna | na | 9662 | 0.046 | 0.6644 | No |
| 13 | Bcl2 | na | 42830 | -0.050 | 0.0889 | No |
| 14 | Apaf1 | na | 45664 | -0.130 | 0.0727 | No |
| 15 | Rb1 | na | 53345 | -0.450 | 0.0538 | No |