Profile of the Running ES Score & Positions of GeneSet Members on the Rank Ordered List
| Dataset | RPKM_matrix___PanKO_vs_ClusterKO.RPKM_matrix___PanKO_vs_ClusterKO.cls #PanKO_versus_ClusterKO |
| Phenotype | RPKM_matrix___PanKO_vs_ClusterKO.cls#PanKO_versus_ClusterKO |
| Upregulated in class | ClusterKO |
| GeneSet | BIOCARTA_PITX2_PATHWAY |
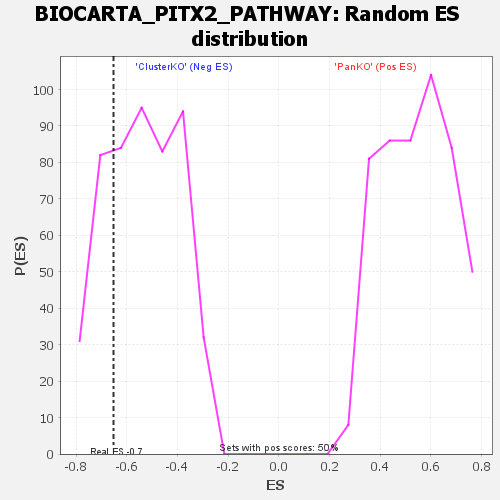
| Enrichment Score (ES) | -0.65218604 |
| Normalized Enrichment Score (NES) | -1.2093414 |
| Nominal p-value | 0.25548902 |
| FDR q-value | 0.9412857 |
| FWER p-Value | 0.715 |
| SYMBOL | TITLE | RANK IN GENE LIST | RANK METRIC SCORE | RUNNING ES | CORE ENRICHMENT | |
|---|---|---|---|---|---|---|
| 1 | Kat5 | na | 4653 | 0.216 | -0.0142 | No |
| 2 | Axin1 | na | 6387 | 0.150 | 0.0026 | No |
| 3 | Pitx2 | na | 11324 | 0.009 | -0.0822 | No |
| 4 | Wnt1 | na | 39420 | -0.004 | -0.5795 | No |
| 5 | Crebbp | na | 43516 | -0.067 | -0.6310 | Yes |
| 6 | Fzd1 | na | 44357 | -0.091 | -0.6171 | Yes |
| 7 | Ctnnb1 | na | 46260 | -0.150 | -0.6035 | Yes |
| 8 | Dvl1 | na | 46509 | -0.158 | -0.5581 | Yes |
| 9 | Apc | na | 47539 | -0.190 | -0.5162 | Yes |
| 10 | Med1 | na | 48429 | -0.222 | -0.4618 | Yes |
| 11 | Trrap | na | 48604 | -0.227 | -0.3930 | Yes |
| 12 | Gsk3b | na | 51467 | -0.346 | -0.3343 | Yes |
| 13 | Ldb1 | na | 51561 | -0.350 | -0.2252 | Yes |
| 14 | Ep300 | na | 52812 | -0.416 | -0.1158 | Yes |
| 15 | Lef1 | na | 54748 | -0.566 | 0.0289 | Yes |