Profile of the Running ES Score & Positions of GeneSet Members on the Rank Ordered List
| Dataset | RPKM_matrix___PanKO_vs_ClusterKO.RPKM_matrix___PanKO_vs_ClusterKO.cls #PanKO_versus_ClusterKO |
| Phenotype | RPKM_matrix___PanKO_vs_ClusterKO.cls#PanKO_versus_ClusterKO |
| Upregulated in class | ClusterKO |
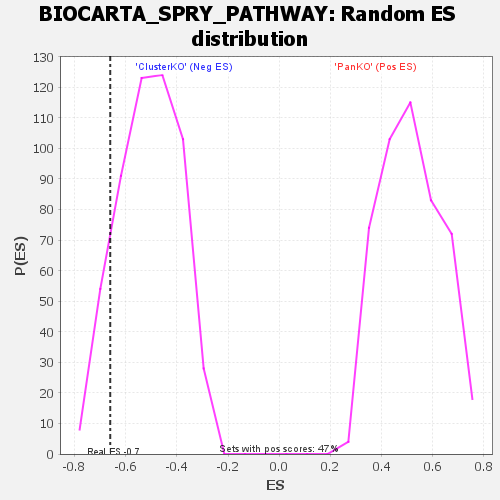
| GeneSet | BIOCARTA_SPRY_PATHWAY |
| Enrichment Score (ES) | -0.6602075 |
| Normalized Enrichment Score (NES) | -1.2975326 |
| Nominal p-value | 0.11299435 |
| FDR q-value | 0.9058274 |
| FWER p-Value | 0.608 |
| SYMBOL | TITLE | RANK IN GENE LIST | RANK METRIC SCORE | RUNNING ES | CORE ENRICHMENT | |
|---|---|---|---|---|---|---|
| 1 | Hras | na | 295 | 0.620 | 0.1198 | No |
| 2 | Spry2 | na | 8217 | 0.087 | -0.0031 | No |
| 3 | Mapk3 | na | 9547 | 0.049 | -0.0168 | No |
| 4 | Egfr | na | 10142 | 0.032 | -0.0208 | No |
| 5 | Grb2 | na | 42417 | -0.041 | -0.5852 | No |
| 6 | Raf1 | na | 42592 | -0.044 | -0.5794 | No |
| 7 | Shc1 | na | 43680 | -0.071 | -0.5843 | No |
| 8 | Spry1 | na | 44676 | -0.101 | -0.5816 | No |
| 9 | Map2k1 | na | 48705 | -0.232 | -0.6064 | Yes |
| 10 | Rasa1 | na | 51740 | -0.358 | -0.5880 | Yes |
| 11 | Cbl | na | 52012 | -0.372 | -0.5178 | Yes |
| 12 | Spry4 | na | 52168 | -0.380 | -0.4439 | Yes |
| 13 | Mapk1 | na | 52790 | -0.415 | -0.3713 | Yes |
| 14 | Egf | na | 53853 | -0.485 | -0.2923 | Yes |
| 15 | Sos1 | na | 54092 | -0.503 | -0.1951 | Yes |
| 16 | Ptprb | na | 56343 | -1.169 | 0.0006 | Yes |