Profile of the Running ES Score & Positions of GeneSet Members on the Rank Ordered List
| Dataset | RPKM_matrix___PanKO_vs_ClusterKO.RPKM_matrix___PanKO_vs_ClusterKO.cls #PanKO_versus_ClusterKO |
| Phenotype | RPKM_matrix___PanKO_vs_ClusterKO.cls#PanKO_versus_ClusterKO |
| Upregulated in class | ClusterKO |
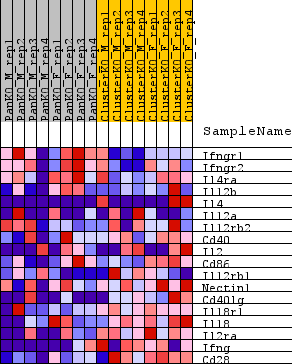
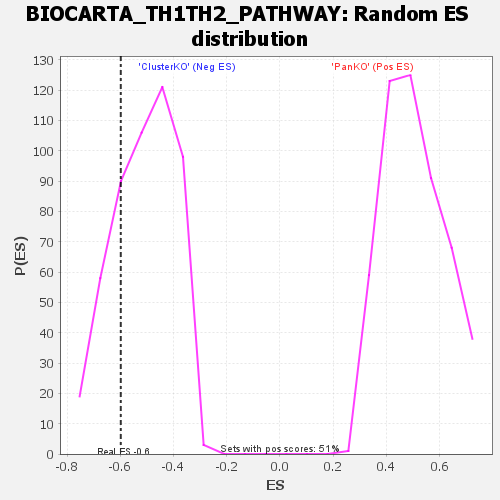
| GeneSet | BIOCARTA_TH1TH2_PATHWAY |
| Enrichment Score (ES) | -0.5979269 |
| Normalized Enrichment Score (NES) | -1.176243 |
| Nominal p-value | 0.22424242 |
| FDR q-value | 0.8631515 |
| FWER p-Value | 0.75 |
| SYMBOL | TITLE | RANK IN GENE LIST | RANK METRIC SCORE | RUNNING ES | CORE ENRICHMENT | |
|---|---|---|---|---|---|---|
| 1 | Ifngr1 | na | 416 | 0.581 | 0.1099 | No |
| 2 | Ifngr2 | na | 2691 | 0.318 | 0.1339 | No |
| 3 | Il4ra | na | 10045 | 0.035 | 0.0105 | No |
| 4 | Il12b | na | 10818 | 0.016 | 0.0001 | No |
| 5 | Il4 | na | 41017 | -0.017 | -0.5322 | No |
| 6 | Il12a | na | 42082 | -0.033 | -0.5444 | No |
| 7 | Il12rb2 | na | 42173 | -0.035 | -0.5388 | No |
| 8 | Cd40 | na | 45505 | -0.125 | -0.5728 | Yes |
| 9 | Il2 | na | 45987 | -0.140 | -0.5530 | Yes |
| 10 | Cd86 | na | 46525 | -0.158 | -0.5306 | Yes |
| 11 | Il12rb1 | na | 48489 | -0.224 | -0.5202 | Yes |
| 12 | Nectin1 | na | 49825 | -0.276 | -0.4882 | Yes |
| 13 | Cd40lg | na | 50281 | -0.295 | -0.4367 | Yes |
| 14 | Il18r1 | na | 50424 | -0.301 | -0.3785 | Yes |
| 15 | Il18 | na | 51708 | -0.356 | -0.3292 | Yes |
| 16 | Il2ra | na | 54971 | -0.593 | -0.2672 | Yes |
| 17 | Ifng | na | 55200 | -0.622 | -0.1456 | Yes |
| 18 | Cd28 | na | 56079 | -0.824 | 0.0053 | Yes |