Profile of the Running ES Score & Positions of GeneSet Members on the Rank Ordered List
| Dataset | RPKM_matrix___PanKO_vs_ClusterKO.RPKM_matrix___PanKO_vs_ClusterKO.cls #PanKO_versus_ClusterKO |
| Phenotype | RPKM_matrix___PanKO_vs_ClusterKO.cls#PanKO_versus_ClusterKO |
| Upregulated in class | ClusterKO |
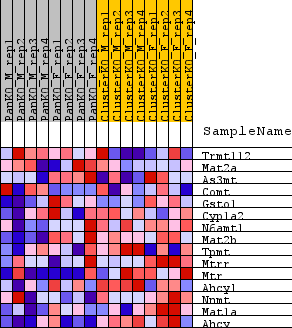
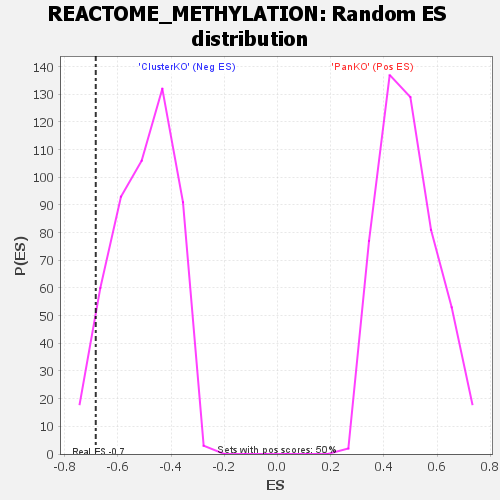
| GeneSet | REACTOME_METHYLATION |
| Enrichment Score (ES) | -0.6832063 |
| Normalized Enrichment Score (NES) | -1.3639561 |
| Nominal p-value | 0.06361829 |
| FDR q-value | 1.0 |
| FWER p-Value | 0.836 |
| SYMBOL | TITLE | RANK IN GENE LIST | RANK METRIC SCORE | RUNNING ES | CORE ENRICHMENT | |
|---|---|---|---|---|---|---|
| 1 | Trmt112 | na | 5221 | 0.193 | -0.0494 | No |
| 2 | Mat2a | na | 5323 | 0.189 | -0.0087 | No |
| 3 | As3mt | na | 5647 | 0.178 | 0.0255 | No |
| 4 | Comt | na | 6969 | 0.130 | 0.0312 | No |
| 5 | Gsto1 | na | 41911 | -0.030 | -0.5819 | No |
| 6 | Cyp1a2 | na | 46967 | -0.172 | -0.6330 | Yes |
| 7 | N6amt1 | na | 49795 | -0.275 | -0.6216 | Yes |
| 8 | Mat2b | na | 50263 | -0.294 | -0.5639 | Yes |
| 9 | Tpmt | na | 50417 | -0.301 | -0.4992 | Yes |
| 10 | Mtrr | na | 50626 | -0.308 | -0.4337 | Yes |
| 11 | Mtr | na | 50875 | -0.319 | -0.3665 | Yes |
| 12 | Ahcyl | na | 52542 | -0.401 | -0.3061 | Yes |
| 13 | Nnmt | na | 53223 | -0.443 | -0.2188 | Yes |
| 14 | Mat1a | na | 53586 | -0.466 | -0.1206 | Yes |
| 15 | Ahcy | na | 55883 | -0.758 | 0.0088 | Yes |