Profile of the Running ES Score & Positions of GeneSet Members on the Rank Ordered List
| Dataset | RPKM_matrix___PanKO_vs_Cyp2c44KO.RPKM_matrix___PanKO_vs_Cyp2c44KO.cls #PanKO_versus_Cyp2c44KO |
| Phenotype | RPKM_matrix___PanKO_vs_Cyp2c44KO.cls#PanKO_versus_Cyp2c44KO |
| Upregulated in class | Cyp2c44KO |
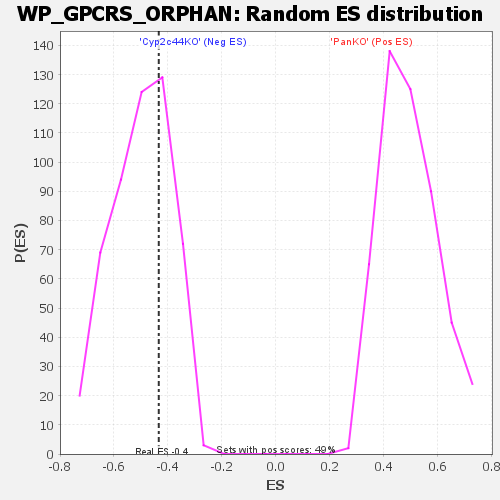
| GeneSet | WP_GPCRS_ORPHAN |
| Enrichment Score (ES) | -0.43402493 |
| Normalized Enrichment Score (NES) | -0.8699212 |
| Nominal p-value | 0.68101764 |
| FDR q-value | 0.8933926 |
| FWER p-Value | 1.0 |
| SYMBOL | TITLE | RANK IN GENE LIST | RANK METRIC SCORE | RUNNING ES | CORE ENRICHMENT | |
|---|---|---|---|---|---|---|
| 1 | Gpr137b | na | 812 | 1.069 | 0.1137 | No |
| 2 | Gpr161 | na | 1168 | 0.946 | 0.2207 | No |
| 3 | Wls | na | 1794 | 0.803 | 0.3058 | No |
| 4 | Gpr31b | na | 6551 | 0.353 | 0.2637 | No |
| 5 | Gpr107 | na | 8678 | 0.246 | 0.2554 | No |
| 6 | Tpra1 | na | 9082 | 0.228 | 0.2756 | No |
| 7 | Gpr89 | na | 10627 | 0.160 | 0.2674 | No |
| 8 | Adgrg4 | na | 29614 | 0.000 | -0.0695 | No |
| 9 | Vmn2r-ps54 | na | 30566 | 0.000 | -0.0864 | No |
| 10 | Gpr165 | na | 33402 | 0.000 | -0.1367 | No |
| 11 | Adgrf2 | na | 47377 | -0.091 | -0.3738 | No |
| 12 | Gpr108 | na | 50774 | -0.258 | -0.4032 | Yes |
| 13 | Gpr180 | na | 50844 | -0.262 | -0.3731 | Yes |
| 14 | Gpr179 | na | 51634 | -0.310 | -0.3500 | Yes |
| 15 | Gpr155 | na | 52221 | -0.352 | -0.3182 | Yes |
| 16 | Gpr137 | na | 54268 | -0.551 | -0.2885 | Yes |
| 17 | Gpr137c | na | 54753 | -0.630 | -0.2217 | Yes |
| 18 | Gpr4 | na | 54841 | -0.644 | -0.1460 | Yes |
| 19 | Adgrf5 | na | 56282 | -1.446 | 0.0017 | Yes |