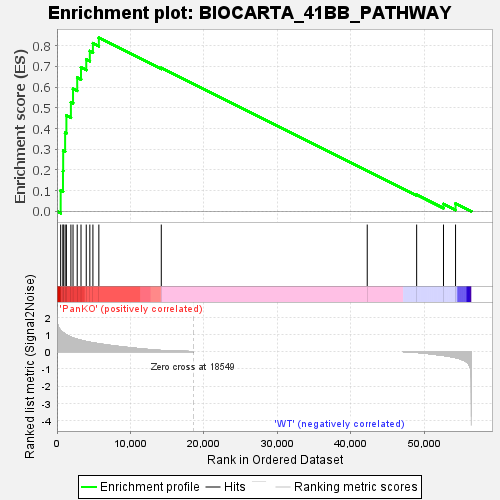
Profile of the Running ES Score & Positions of GeneSet Members on the Rank Ordered List
| Dataset | RPKM_matrix___PanKO_vs_WT.RPKM_matrix___PanKO_vs_WT.cls#PanKO_versus_WT |
| Phenotype | RPKM_matrix___PanKO_vs_WT.cls#PanKO_versus_WT |
| Upregulated in class | PanKO |
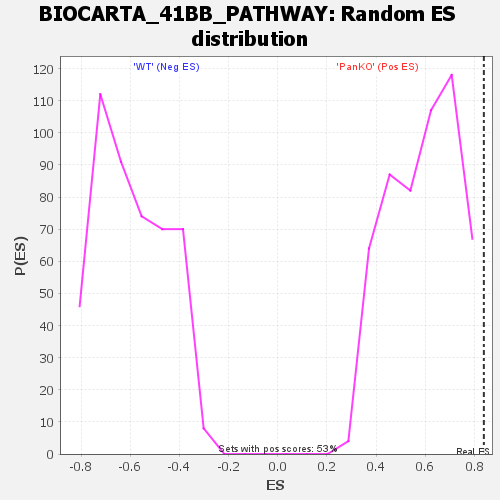
| GeneSet | BIOCARTA_41BB_PATHWAY |
| Enrichment Score (ES) | 0.8378994 |
| Normalized Enrichment Score (NES) | 1.421982 |
| Nominal p-value | 0.0 |
| FDR q-value | 0.0850151 |
| FWER p-Value | 0.153 |
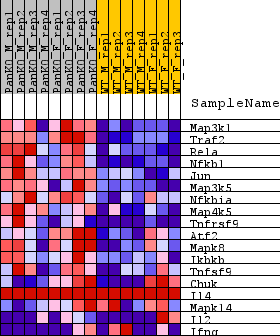
| SYMBOL | TITLE | RANK IN GENE LIST | RANK METRIC SCORE | RUNNING ES | CORE ENRICHMENT | |
|---|---|---|---|---|---|---|
| 1 | Map3k1 | na | 499 | 1.220 | 0.1014 | Yes |
| 2 | Traf2 | na | 815 | 1.098 | 0.1950 | Yes |
| 3 | Rela | na | 840 | 1.090 | 0.2930 | Yes |
| 4 | Nfkb1 | na | 1104 | 1.005 | 0.3792 | Yes |
| 5 | Jun | na | 1278 | 0.959 | 0.4627 | Yes |
| 6 | Map3k5 | na | 1892 | 0.829 | 0.5267 | Yes |
| 7 | Nfkbia | na | 2180 | 0.779 | 0.5920 | Yes |
| 8 | Map4k5 | na | 2750 | 0.705 | 0.6456 | Yes |
| 9 | Tnfrsf9 | na | 3267 | 0.645 | 0.6948 | Yes |
| 10 | Atf2 | na | 3980 | 0.577 | 0.7342 | Yes |
| 11 | Mapk8 | na | 4468 | 0.534 | 0.7738 | Yes |
| 12 | Ikbkb | na | 4887 | 0.502 | 0.8118 | Yes |
| 13 | Tnfsf9 | na | 5695 | 0.448 | 0.8379 | Yes |
| 14 | Chuk | na | 14191 | 0.059 | 0.6925 | No |
| 15 | Il4 | na | 42217 | 0.000 | 0.1952 | No |
| 16 | Mapk14 | na | 48942 | -0.047 | 0.0801 | No |
| 17 | Il2 | na | 52594 | -0.225 | 0.0356 | No |
| 18 | Ifng | na | 54235 | -0.348 | 0.0380 | No |