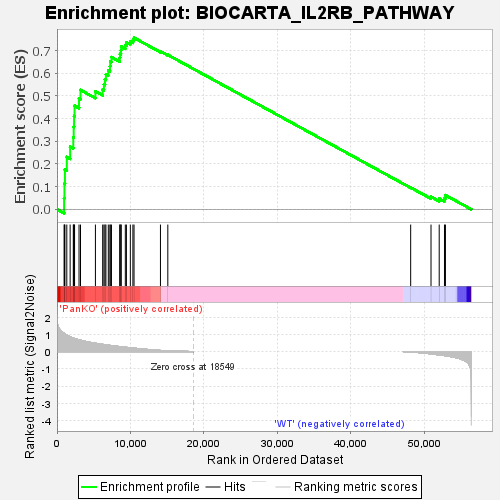
Profile of the Running ES Score & Positions of GeneSet Members on the Rank Ordered List
| Dataset | RPKM_matrix___PanKO_vs_WT.RPKM_matrix___PanKO_vs_WT.cls#PanKO_versus_WT |
| Phenotype | RPKM_matrix___PanKO_vs_WT.cls#PanKO_versus_WT |
| Upregulated in class | PanKO |
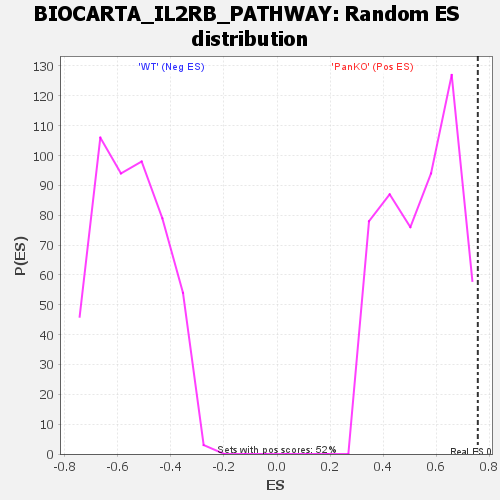
| GeneSet | BIOCARTA_IL2RB_PATHWAY |
| Enrichment Score (ES) | 0.7563831 |
| Normalized Enrichment Score (NES) | 1.3840952 |
| Nominal p-value | 0.009615385 |
| FDR q-value | 0.10953433 |
| FWER p-Value | 0.265 |
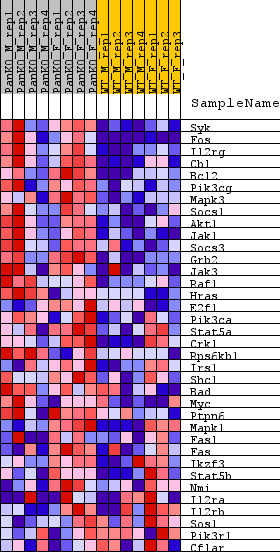
| SYMBOL | TITLE | RANK IN GENE LIST | RANK METRIC SCORE | RUNNING ES | CORE ENRICHMENT | |
|---|---|---|---|---|---|---|
| 1 | Syk | na | 968 | 1.050 | 0.0488 | Yes |
| 2 | Fos | na | 1014 | 1.036 | 0.1131 | Yes |
| 3 | Il2rg | na | 1077 | 1.011 | 0.1756 | Yes |
| 4 | Cbl | na | 1334 | 0.947 | 0.2306 | Yes |
| 5 | Bcl2 | na | 1788 | 0.850 | 0.2760 | Yes |
| 6 | Pik3cg | na | 2217 | 0.774 | 0.3171 | Yes |
| 7 | Mapk3 | na | 2271 | 0.767 | 0.3643 | Yes |
| 8 | Socs1 | na | 2328 | 0.758 | 0.4110 | Yes |
| 9 | Akt1 | na | 2391 | 0.749 | 0.4570 | Yes |
| 10 | Jak1 | na | 2997 | 0.675 | 0.4887 | Yes |
| 11 | Socs3 | na | 3198 | 0.653 | 0.5262 | Yes |
| 12 | Grb2 | na | 5228 | 0.478 | 0.5202 | Yes |
| 13 | Jak3 | na | 6215 | 0.413 | 0.5287 | Yes |
| 14 | Raf1 | na | 6384 | 0.403 | 0.5510 | Yes |
| 15 | Hras | na | 6526 | 0.393 | 0.5732 | Yes |
| 16 | E2f1 | na | 6655 | 0.386 | 0.5952 | Yes |
| 17 | Pik3ca | na | 6982 | 0.367 | 0.6125 | Yes |
| 18 | Stat5a | na | 7206 | 0.354 | 0.6308 | Yes |
| 19 | Crkl | na | 7245 | 0.352 | 0.6523 | Yes |
| 20 | Rps6kb1 | na | 7411 | 0.344 | 0.6709 | Yes |
| 21 | Irs1 | na | 8540 | 0.284 | 0.6688 | Yes |
| 22 | Shc1 | na | 8578 | 0.282 | 0.6859 | Yes |
| 23 | Bad | na | 8695 | 0.277 | 0.7012 | Yes |
| 24 | Myc | na | 8734 | 0.274 | 0.7178 | Yes |
| 25 | Ptpn6 | na | 9296 | 0.248 | 0.7234 | Yes |
| 26 | Mapk1 | na | 9447 | 0.241 | 0.7359 | Yes |
| 27 | Fasl | na | 9980 | 0.218 | 0.7402 | Yes |
| 28 | Fas | na | 10328 | 0.202 | 0.7468 | Yes |
| 29 | Ikzf3 | na | 10482 | 0.196 | 0.7564 | Yes |
| 30 | Stat5b | na | 14078 | 0.062 | 0.6964 | No |
| 31 | Nmi | na | 15080 | 0.039 | 0.6811 | No |
| 32 | Il2ra | na | 48129 | -0.022 | 0.0960 | No |
| 33 | Il2rb | na | 50896 | -0.133 | 0.0552 | No |
| 34 | Sos1 | na | 52011 | -0.192 | 0.0476 | No |
| 35 | Pik3r1 | na | 52729 | -0.233 | 0.0495 | No |
| 36 | Cflar | na | 52859 | -0.242 | 0.0624 | No |