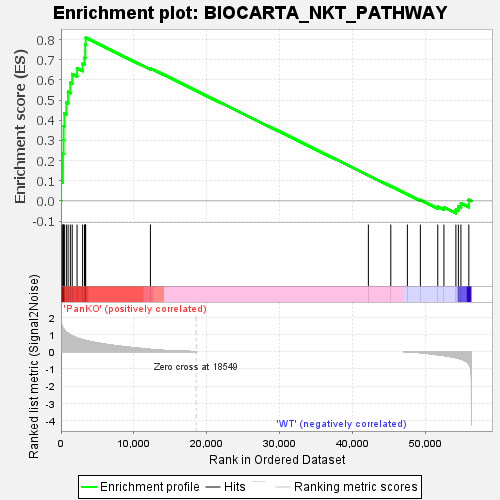
Profile of the Running ES Score & Positions of GeneSet Members on the Rank Ordered List
| Dataset | RPKM_matrix___PanKO_vs_WT.RPKM_matrix___PanKO_vs_WT.cls#PanKO_versus_WT |
| Phenotype | RPKM_matrix___PanKO_vs_WT.cls#PanKO_versus_WT |
| Upregulated in class | PanKO |
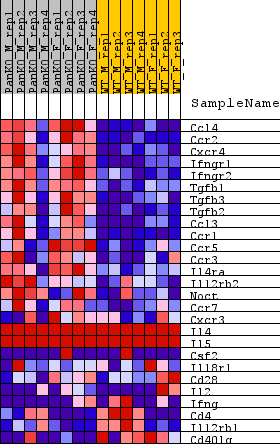
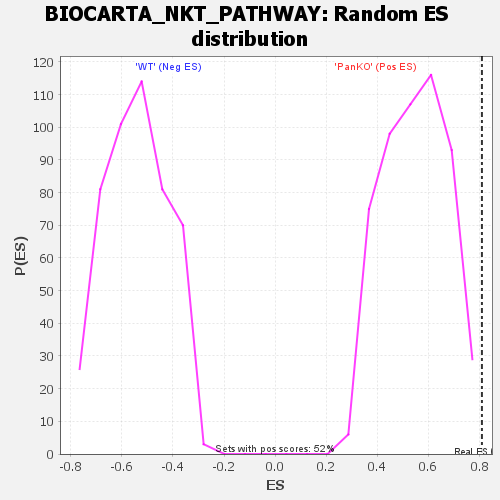
| GeneSet | BIOCARTA_NKT_PATHWAY |
| Enrichment Score (ES) | 0.8093641 |
| Normalized Enrichment Score (NES) | 1.472961 |
| Nominal p-value | 0.001908397 |
| FDR q-value | 0.12757926 |
| FWER p-Value | 0.059 |
| SYMBOL | TITLE | RANK IN GENE LIST | RANK METRIC SCORE | RUNNING ES | CORE ENRICHMENT | |
|---|---|---|---|---|---|---|
| 1 | Ccl4 | na | 16 | 1.780 | 0.0942 | Yes |
| 2 | Ccr2 | na | 255 | 1.367 | 0.1625 | Yes |
| 3 | Cxcr4 | na | 260 | 1.363 | 0.2347 | Yes |
| 4 | Ifngr1 | na | 348 | 1.299 | 0.3021 | Yes |
| 5 | Ifngr2 | na | 360 | 1.293 | 0.3705 | Yes |
| 6 | Tgfb1 | na | 464 | 1.234 | 0.4341 | Yes |
| 7 | Tgfb3 | na | 735 | 1.123 | 0.4889 | Yes |
| 8 | Tgfb2 | na | 976 | 1.049 | 0.5403 | Yes |
| 9 | Ccl3 | na | 1283 | 0.958 | 0.5857 | Yes |
| 10 | Ccr1 | na | 1540 | 0.901 | 0.6290 | Yes |
| 11 | Ccr5 | na | 2206 | 0.776 | 0.6583 | Yes |
| 12 | Ccr3 | na | 2968 | 0.679 | 0.6808 | Yes |
| 13 | Il4ra | na | 3234 | 0.649 | 0.7105 | Yes |
| 14 | Il12rb2 | na | 3322 | 0.640 | 0.7430 | Yes |
| 15 | Noct | na | 3323 | 0.640 | 0.7769 | Yes |
| 16 | Ccr7 | na | 3389 | 0.633 | 0.8094 | Yes |
| 17 | Cxcr3 | na | 12280 | 0.120 | 0.6580 | No |
| 18 | Il4 | na | 42217 | 0.000 | 0.1267 | No |
| 19 | Il5 | na | 45296 | 0.000 | 0.0721 | No |
| 20 | Csf2 | na | 47574 | -0.010 | 0.0322 | No |
| 21 | Il18r1 | na | 49357 | -0.063 | 0.0040 | No |
| 22 | Cd28 | na | 51745 | -0.179 | -0.0289 | No |
| 23 | Il2 | na | 52594 | -0.225 | -0.0320 | No |
| 24 | Ifng | na | 54235 | -0.348 | -0.0427 | No |
| 25 | Cd4 | na | 54577 | -0.384 | -0.0284 | No |
| 26 | Il12rb1 | na | 54926 | -0.432 | -0.0116 | No |
| 27 | Cd40lg | na | 56014 | -0.704 | 0.0064 | No |