Profile of the Running ES Score & Positions of GeneSet Members on the Rank Ordered List
| Dataset | RPKM_matrix___PanKO_vs_WT.RPKM_matrix___PanKO_vs_WT.cls#PanKO_versus_WT |
| Phenotype | RPKM_matrix___PanKO_vs_WT.cls#PanKO_versus_WT |
| Upregulated in class | WT |
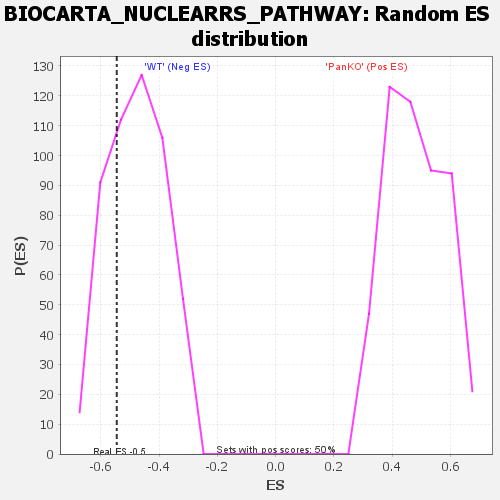
| GeneSet | BIOCARTA_NUCLEARRS_PATHWAY |
| Enrichment Score (ES) | -0.54557604 |
| Normalized Enrichment Score (NES) | -1.1416907 |
| Nominal p-value | 0.26494023 |
| FDR q-value | 0.19958645 |
| FWER p-Value | 0.722 |
| SYMBOL | TITLE | RANK IN GENE LIST | RANK METRIC SCORE | RUNNING ES | CORE ENRICHMENT | |
|---|---|---|---|---|---|---|
| 1 | Abcg1 | na | 553 | 1.198 | 0.0556 | No |
| 2 | Rarg | na | 772 | 1.112 | 0.1124 | No |
| 3 | Vdr | na | 1335 | 0.947 | 0.1541 | No |
| 4 | Abcb1a | na | 2572 | 0.728 | 0.1719 | No |
| 5 | Abcb1b | na | 2586 | 0.726 | 0.2113 | No |
| 6 | Cyp3a11 | na | 3480 | 0.622 | 0.2294 | No |
| 7 | Cyp27b1 | na | 3956 | 0.579 | 0.2526 | No |
| 8 | Rarb | na | 6318 | 0.406 | 0.2328 | No |
| 9 | Cyp24a1 | na | 11131 | 0.168 | 0.1566 | No |
| 10 | Rara | na | 11635 | 0.145 | 0.1556 | No |
| 11 | Abca1 | na | 12612 | 0.108 | 0.1441 | No |
| 12 | Nr0b2 | na | 12962 | 0.096 | 0.1432 | No |
| 13 | Abcb11 | na | 16387 | 0.018 | 0.0834 | No |
| 14 | Cyp1a2 | na | 16838 | 0.012 | 0.0761 | No |
| 15 | Abcc2 | na | 47938 | -0.018 | -0.4749 | No |
| 16 | Abcd2 | na | 49972 | -0.087 | -0.5062 | No |
| 17 | Nr1i2 | na | 50099 | -0.094 | -0.5034 | No |
| 18 | Cyp4a12b | na | 50319 | -0.103 | -0.5016 | No |
| 19 | Pparg | na | 50619 | -0.119 | -0.5004 | No |
| 20 | Abcg5 | na | 50653 | -0.121 | -0.4944 | No |
| 21 | Nr1h3 | na | 50853 | -0.131 | -0.4908 | No |
| 22 | Ppard | na | 51935 | -0.188 | -0.4997 | No |
| 23 | Abcc3 | na | 53096 | -0.260 | -0.5061 | No |
| 24 | Ppara | na | 55321 | -0.496 | -0.5185 | Yes |
| 25 | Abcd3 | na | 55420 | -0.517 | -0.4920 | Yes |
| 26 | Nr1h4 | na | 55554 | -0.549 | -0.4644 | Yes |
| 27 | Cyp26a1 | na | 55591 | -0.559 | -0.4345 | Yes |
| 28 | Nr1i3 | na | 56088 | -0.767 | -0.4015 | Yes |
| 29 | Cyp4b1 | na | 56102 | -0.776 | -0.3593 | Yes |
| 30 | Cyp2e1 | na | 56174 | -0.819 | -0.3159 | Yes |
| 31 | Cyp8b1 | na | 56369 | -1.582 | -0.2330 | Yes |
| 32 | Cyp2c70 | na | 56377 | -4.271 | 0.0000 | Yes |