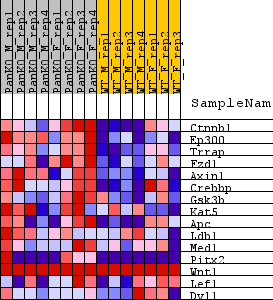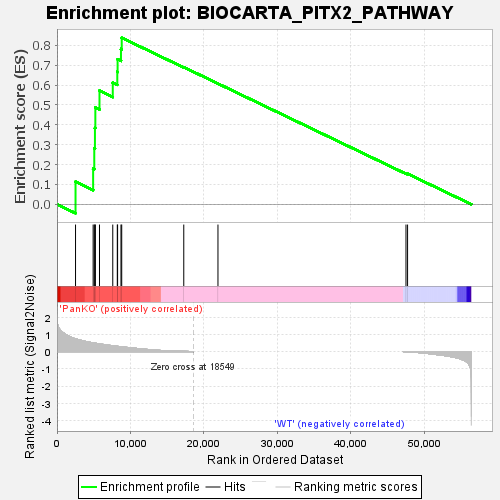
Profile of the Running ES Score & Positions of GeneSet Members on the Rank Ordered List
| Dataset | RPKM_matrix___PanKO_vs_WT.RPKM_matrix___PanKO_vs_WT.cls#PanKO_versus_WT |
| Phenotype | RPKM_matrix___PanKO_vs_WT.cls#PanKO_versus_WT |
| Upregulated in class | PanKO |
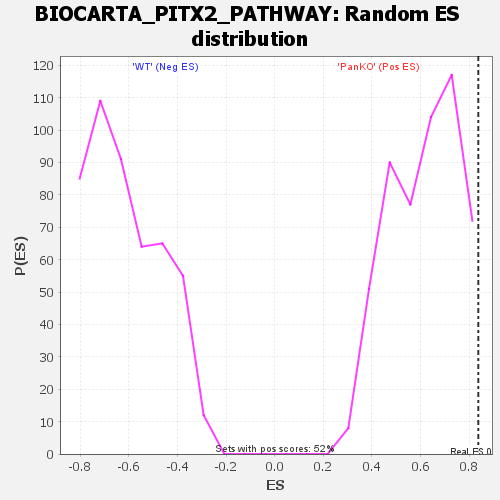
| GeneSet | BIOCARTA_PITX2_PATHWAY |
| Enrichment Score (ES) | 0.837563 |
| Normalized Enrichment Score (NES) | 1.3636192 |
| Nominal p-value | 0.0038535646 |
| FDR q-value | 0.08715089 |
| FWER p-Value | 0.339 |
| SYMBOL | TITLE | RANK IN GENE LIST | RANK METRIC SCORE | RUNNING ES | CORE ENRICHMENT | |
|---|---|---|---|---|---|---|
| 1 | Ctnnb1 | na | 2522 | 0.735 | 0.1138 | Yes |
| 2 | Ep300 | na | 4917 | 0.500 | 0.1792 | Yes |
| 3 | Trrap | na | 5072 | 0.489 | 0.2819 | Yes |
| 4 | Fzd1 | na | 5163 | 0.483 | 0.3845 | Yes |
| 5 | Axin1 | na | 5218 | 0.478 | 0.4867 | Yes |
| 6 | Crebbp | na | 5782 | 0.441 | 0.5719 | Yes |
| 7 | Gsk3b | na | 7589 | 0.334 | 0.6119 | Yes |
| 8 | Kat5 | na | 8205 | 0.301 | 0.6659 | Yes |
| 9 | Apc | na | 8246 | 0.298 | 0.7295 | Yes |
| 10 | Ldb1 | na | 8706 | 0.276 | 0.7808 | Yes |
| 11 | Med1 | na | 8807 | 0.271 | 0.8376 | Yes |
| 12 | Pitx2 | na | 17251 | 0.009 | 0.6896 | No |
| 13 | Wnt1 | na | 21904 | 0.000 | 0.6071 | No |
| 14 | Lef1 | na | 47490 | -0.008 | 0.1549 | No |
| 15 | Dvl1 | na | 47707 | -0.013 | 0.1538 | No |