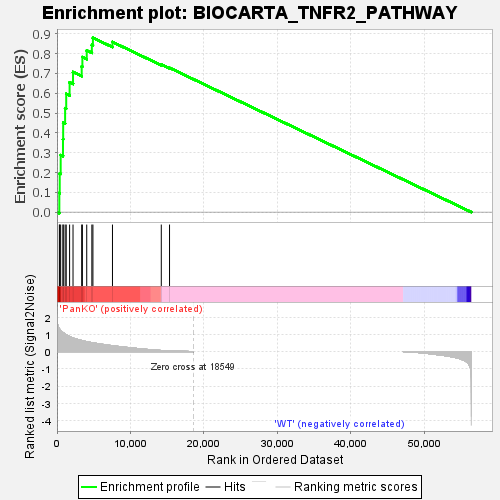
Profile of the Running ES Score & Positions of GeneSet Members on the Rank Ordered List
| Dataset | RPKM_matrix___PanKO_vs_WT.RPKM_matrix___PanKO_vs_WT.cls#PanKO_versus_WT |
| Phenotype | RPKM_matrix___PanKO_vs_WT.cls#PanKO_versus_WT |
| Upregulated in class | PanKO |
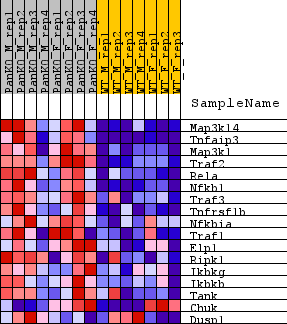
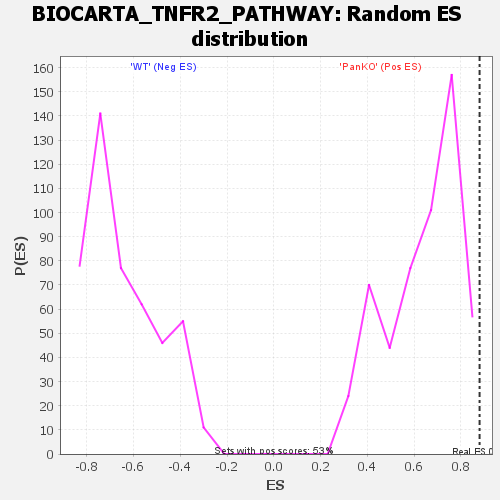
| GeneSet | BIOCARTA_TNFR2_PATHWAY |
| Enrichment Score (ES) | 0.8802331 |
| Normalized Enrichment Score (NES) | 1.3744072 |
| Nominal p-value | 0.0018867925 |
| FDR q-value | 0.08272907 |
| FWER p-Value | 0.301 |
| SYMBOL | TITLE | RANK IN GENE LIST | RANK METRIC SCORE | RUNNING ES | CORE ENRICHMENT | |
|---|---|---|---|---|---|---|
| 1 | Map3k14 | na | 318 | 1.317 | 0.0964 | Yes |
| 2 | Tnfaip3 | na | 369 | 1.287 | 0.1953 | Yes |
| 3 | Map3k1 | na | 499 | 1.220 | 0.2876 | Yes |
| 4 | Traf2 | na | 815 | 1.098 | 0.3672 | Yes |
| 5 | Rela | na | 840 | 1.090 | 0.4513 | Yes |
| 6 | Nfkb1 | na | 1104 | 1.005 | 0.5246 | Yes |
| 7 | Traf3 | na | 1254 | 0.963 | 0.5965 | Yes |
| 8 | Tnfrsf1b | na | 1715 | 0.862 | 0.6552 | Yes |
| 9 | Nfkbia | na | 2180 | 0.779 | 0.7074 | Yes |
| 10 | Traf1 | na | 3360 | 0.637 | 0.7358 | Yes |
| 11 | Elp1 | na | 3454 | 0.626 | 0.7826 | Yes |
| 12 | Ripk1 | na | 4046 | 0.570 | 0.8164 | Yes |
| 13 | Ikbkg | na | 4743 | 0.514 | 0.8439 | Yes |
| 14 | Ikbkb | na | 4887 | 0.502 | 0.8802 | Yes |
| 15 | Tank | na | 7548 | 0.336 | 0.8591 | No |
| 16 | Chuk | na | 14191 | 0.059 | 0.7458 | No |
| 17 | Dusp1 | na | 15314 | 0.034 | 0.7286 | No |