Profile of the Running ES Score & Positions of GeneSet Members on the Rank Ordered List
| Dataset | RPKM_matrix___PanKO_vs_WT.RPKM_matrix___PanKO_vs_WT.cls#PanKO_versus_WT |
| Phenotype | RPKM_matrix___PanKO_vs_WT.cls#PanKO_versus_WT |
| Upregulated in class | WT |
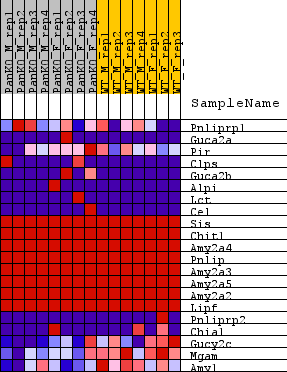
| GeneSet | REACTOME_DIGESTION |
| Enrichment Score (ES) | -0.67957586 |
| Normalized Enrichment Score (NES) | -1.2829423 |
| Nominal p-value | 0.14787431 |
| FDR q-value | 0.5692325 |
| FWER p-Value | 0.919 |
| SYMBOL | TITLE | RANK IN GENE LIST | RANK METRIC SCORE | RUNNING ES | CORE ENRICHMENT | |
|---|---|---|---|---|---|---|
| 1 | Pnliprp1 | na | 8508 | 0.286 | -0.0226 | No |
| 2 | Guca2a | na | 11895 | 0.134 | -0.0224 | No |
| 3 | Pir | na | 14640 | 0.048 | -0.0495 | No |
| 4 | Clps | na | 15090 | 0.039 | -0.0400 | No |
| 5 | Guca2b | na | 15339 | 0.034 | -0.0292 | No |
| 6 | Alpi | na | 16949 | 0.012 | -0.0526 | No |
| 7 | Lct | na | 18098 | 0.003 | -0.0716 | No |
| 8 | Cel | na | 18252 | 0.002 | -0.0734 | No |
| 9 | Sis | na | 22581 | 0.000 | -0.1501 | No |
| 10 | Chit1 | na | 27481 | 0.000 | -0.2371 | No |
| 11 | Amy2a4 | na | 31878 | 0.000 | -0.3151 | No |
| 12 | Pnlip | na | 37549 | 0.000 | -0.4157 | No |
| 13 | Amy2a3 | na | 42179 | 0.000 | -0.4978 | No |
| 14 | Amy2a5 | na | 42590 | 0.000 | -0.5051 | No |
| 15 | Amy2a2 | na | 44125 | 0.000 | -0.5323 | No |
| 16 | Lipf | na | 44710 | 0.000 | -0.5427 | No |
| 17 | Pnliprp2 | na | 47528 | -0.009 | -0.5886 | No |
| 18 | Chia1 | na | 49914 | -0.084 | -0.5933 | Yes |
| 19 | Gucy2c | na | 54777 | -0.410 | -0.4953 | Yes |
| 20 | Mgam | na | 55578 | -0.557 | -0.2593 | Yes |
| 21 | Amy1 | na | 55788 | -0.609 | 0.0105 | Yes |