Profile of the Running ES Score & Positions of GeneSet Members on the Rank Ordered List
| Dataset | RPKM_matrix___PanKO_vs_WT.RPKM_matrix___PanKO_vs_WT.cls#PanKO_versus_WT |
| Phenotype | RPKM_matrix___PanKO_vs_WT.cls#PanKO_versus_WT |
| Upregulated in class | WT |
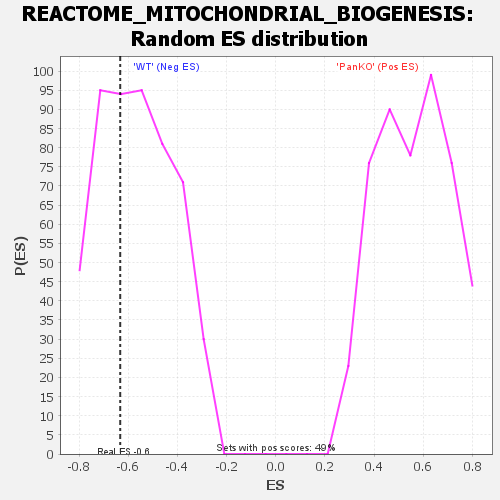
| GeneSet | REACTOME_MITOCHONDRIAL_BIOGENESIS |
| Enrichment Score (ES) | -0.6327631 |
| Normalized Enrichment Score (NES) | -1.1218412 |
| Nominal p-value | 0.34241244 |
| FDR q-value | 0.77165043 |
| FWER p-Value | 0.998 |
| SYMBOL | TITLE | RANK IN GENE LIST | RANK METRIC SCORE | RUNNING ES | CORE ENRICHMENT | |
|---|---|---|---|---|---|---|
| 1 | Gabpb1 | na | 2922 | 0.685 | 0.0564 | No |
| 2 | Atp5l | na | 9234 | 0.251 | -0.0159 | No |
| 3 | Gabpa | na | 9986 | 0.218 | 0.0052 | No |
| 4 | Dmac2l | na | 10922 | 0.176 | 0.0165 | No |
| 5 | Idh2 | na | 11078 | 0.170 | 0.0405 | No |
| 6 | Cycs | na | 15064 | 0.039 | -0.0240 | No |
| 7 | Atp5b | na | 15118 | 0.038 | -0.0189 | No |
| 8 | Atp5pb | na | 16174 | 0.020 | -0.0344 | No |
| 9 | Glud1 | na | 16757 | 0.013 | -0.0426 | No |
| 10 | Atp5g3 | na | 47757 | -0.014 | -0.5905 | No |
| 11 | Gm10053 | na | 47800 | -0.015 | -0.5890 | No |
| 12 | mt-Atp6 | na | 48305 | -0.028 | -0.5935 | No |
| 13 | Atp5e | na | 48597 | -0.035 | -0.5932 | No |
| 14 | mt-Atp8 | na | 50830 | -0.130 | -0.6122 | Yes |
| 15 | Atp5c1 | na | 51070 | -0.142 | -0.5940 | Yes |
| 16 | Atp5g1 | na | 51151 | -0.146 | -0.5723 | Yes |
| 17 | Atp5h | na | 51220 | -0.149 | -0.5499 | Yes |
| 18 | Atp5k | na | 51740 | -0.178 | -0.5309 | Yes |
| 19 | Atp5j2 | na | 52144 | -0.198 | -0.5069 | Yes |
| 20 | Atp5a1 | na | 52176 | -0.199 | -0.4759 | Yes |
| 21 | Atp5j | na | 52311 | -0.208 | -0.4454 | Yes |
| 22 | Sod2 | na | 52543 | -0.222 | -0.4144 | Yes |
| 23 | Sirt4 | na | 52936 | -0.249 | -0.3821 | Yes |
| 24 | Atp5o | na | 53037 | -0.256 | -0.3433 | Yes |
| 25 | Atp5d | na | 53377 | -0.279 | -0.3052 | Yes |
| 26 | Sirt5 | na | 55459 | -0.526 | -0.2590 | Yes |
| 27 | Sirt3 | na | 55908 | -0.656 | -0.1633 | Yes |
| 28 | Acss2 | na | 56311 | -1.086 | 0.0012 | Yes |