Profile of the Running ES Score & Positions of GeneSet Members on the Rank Ordered List
| Dataset | RPKM_matrix___PanKO_vs_WT.RPKM_matrix___PanKO_vs_WT.cls#PanKO_versus_WT |
| Phenotype | RPKM_matrix___PanKO_vs_WT.cls#PanKO_versus_WT |
| Upregulated in class | PanKO |
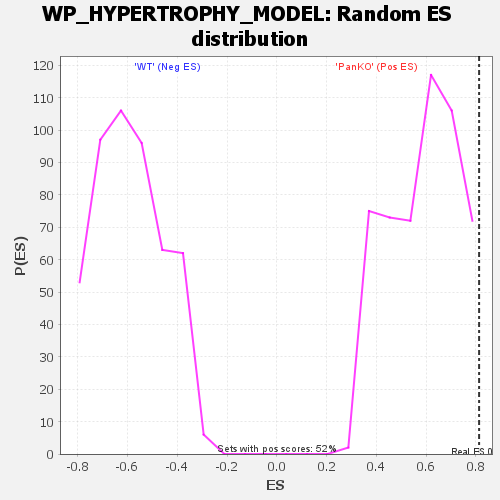
| GeneSet | WP_HYPERTROPHY_MODEL |
| Enrichment Score (ES) | 0.81256664 |
| Normalized Enrichment Score (NES) | 1.3884048 |
| Nominal p-value | 0.00967118 |
| FDR q-value | 0.41666105 |
| FWER p-Value | 0.427 |
| SYMBOL | TITLE | RANK IN GENE LIST | RANK METRIC SCORE | RUNNING ES | CORE ENRICHMENT | |
|---|---|---|---|---|---|---|
| 1 | Atf3 | na | 164 | 1.449 | 0.1040 | Yes |
| 2 | Nr4a3 | na | 212 | 1.404 | 0.2068 | Yes |
| 3 | Ccn1 | na | 343 | 1.301 | 0.3005 | Yes |
| 4 | Wdr1 | na | 746 | 1.119 | 0.3760 | Yes |
| 5 | Hbegf | na | 1271 | 0.960 | 0.4375 | Yes |
| 6 | Jund | na | 1556 | 0.899 | 0.4988 | Yes |
| 7 | Ifrd1 | na | 1833 | 0.842 | 0.5560 | Yes |
| 8 | Eif4ebp1 | na | 2481 | 0.740 | 0.5991 | Yes |
| 9 | Eif4e | na | 2524 | 0.735 | 0.6526 | Yes |
| 10 | Il1a | na | 2871 | 0.690 | 0.6974 | Yes |
| 11 | Adam10 | na | 3348 | 0.637 | 0.7360 | Yes |
| 12 | Il1r1 | na | 4846 | 0.506 | 0.7468 | Yes |
| 13 | Zeb1 | na | 5062 | 0.490 | 0.7791 | Yes |
| 14 | Dusp14 | na | 5180 | 0.482 | 0.8126 | Yes |
| 15 | Myog | na | 38280 | 0.000 | 0.2253 | No |
| 16 | Il18 | na | 53267 | -0.271 | -0.0206 | No |
| 17 | Mstn | na | 53603 | -0.296 | -0.0048 | No |
| 18 | Ifng | na | 54235 | -0.348 | 0.0098 | No |
| 19 | Vegfa | na | 54570 | -0.383 | 0.0321 | No |