ORIO help
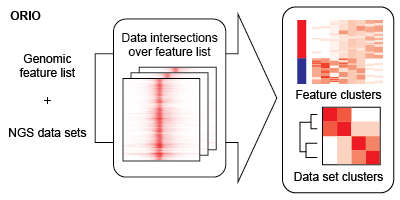
ORIO (Online Resource for Integrative Omics) is an analysis platform for data from next generation sequencing (NGS). ORIO enables rapid analysis and integration of NGS data sets. ORIO was designed based on three central observations:
- Diverse biological phenomena may be represented by discrete positions in genomic space. Think protein binding sites for transcription factor regulation or transcription start sites for transcription initiation.
- Despite a wide diversity of NGS experiment and data types, analysis of NGS data often involves consideration and manipulation of genomic read coverage.
- Visual inspection remains a critical component of analysis.
The bulk of analysis is performed using the ORIO analysis package . An ORIO analysis run consists of two steps. First, the intersections between a feature list of genomic coordinates and a number of NGS data sets are found. Second, the NGS data sets are correlated based on these intersection values. The output of these steps may be dynamically visualized using ORIO-web .
ORIO has been published in Lavender et al. 2017 . To cite in your publications:
Lavender CA, Shapiro AJ, Burkholder AB, Bennett BD, Adelman K, Fargo DC. ORIO (Online Resource for Integrative Omics): a web-based platform for rapid integration of next generation sequencing data. Nucleic Acids Res. 2017 Jun 2; 45 (10): 5678-5690. doi: 10.1093/nar/gkx270.
Data intersection
The intersection of a feature list is iteratively found for each NGS dataset in an analysis. This intersection describes the overlap of read coverage from the NGS data across genomic windows anchored on feature list positions.
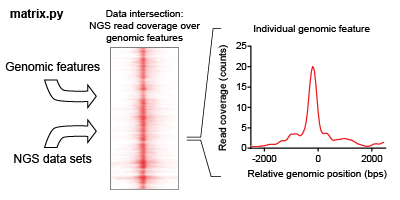
ORIO focuses its analysis on a list of genomic coordinates selected called a feature list. This feature list may be uploaded as a BED file (hyperlink), or the user may select from genomic feature lists hosted by ORIO. Analysis is performed considering genomic windows about each feature. Dimensions of the windows may be adjusted using the ‘bin start,’ ‘bin number,’ and ‘bin size’ parameters when setting up an analysis.
ORIO iteratively finds the intersection of selected NGS datasets with the genomic feature list. The reads intersecting with each feature window are found for each dataset. Datasets may be uploaded as read coverage bigwig files (hyperlink). If stranded data is being considered, two separate bigwig files corresponding to forward and reverse strands may be used. Alternatively, the user may select from hosted datasets taken from the first production run of ENCODE.
ORIO is able to find data intersections considering strand information. If strand information is included in the associated BED file, read coverage will be found respecting the strand of each feature: areas downstream of a feature will be given higher values while areas upstream will be given lower values. If the NGS data is stranded (i.e. forward and reverse strand bigWigs are available), then only coverage on the same strand of a stranded feature will be considered.
The product of the data intersection is a two-dimensional matrix, where each row corresponds to a genomic feature and each column corresponds to a bin of the genomic window. The user can download these files through the ‘Download zip’ button on an analysis page; the ‘Download zip’ command allows the user to access any pertinent data relevant to an analysis. Matrices generated in the data intersection step are then used in the correlative analysis step.
Correlative analysis
Using matrices generated in the data intersection step, ORIO then performs correlative analysis based on compiled read coverage values. NGS datasets and genomic features are grouped by hierarchical clustering and k-means clustering, respectively. Associations discovered through clustering can implicate important coordination of biological functions.
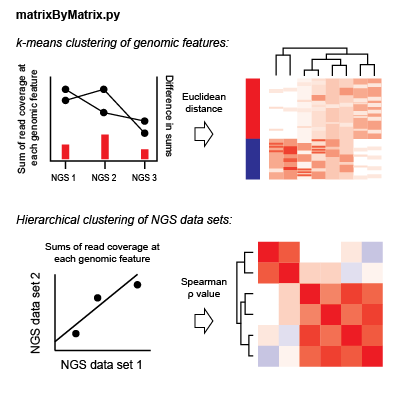
For each NGS dataset, there is a matrix of coverage values for each genomic feature in an analysis. For each dataset pair, the Spearman correlation value is found considering coverage values at each feature; the coverage value used is the sum of coverage across all bins in a genomic window. Hierarchical clustering is performed considering Spearman rho values as the pairwise distance metric.
To cluster genomic features, the total read coverage in a genomic window for each NGS dataset is concatenated to give a one-dimensional data vector for each feature in an analysis. These vectors are normalized by the variance in each dataset. For each pair of features, the Euclidean distance is found considering these normalized data vectors. k-means clustering is performed observing these distances iteratively with k-values from 2 to 10. Clustering values for each k are saved for future display.
Though read coverage is informative for many genomics experiments, in some NGS experiments specialized analytical techniques must be applied to read coverage in order to generate useful data metrics. Also, many non-NGS approaches are relevant for genomics analysis. Acknowledging this, ORIO allows the user to provide a single data value for each genomic feature to be used in correlative analysis of independent NGS datasets. We call this data set the sort vector. A sort vector may be provided at the onset of analysis in the form of a two-column tab-delimited text file where the first column contains feature names and the second contains data values.
If a sort vector is used, hierarchical clustering is performed focused on the sort vector. Read coverage values for each NGS dataset are correlated with data values in the sort vector by Spearman test. These correlation values are found for read coverages in each genomic window bin. For each dataset, correlation values for each bin are concatenated into a one-dimensional vector. For each dataset pair, the Euclidean distance between these data vectors is found, and the Euclidean distance is used as the distance metric in hierarchical clustering. k-means clustering is performed the same in analyses with and without a sort vector.
Correlative analysis results are stored for access and display by the web application ORIO-web.
Data management and display of results
ORIO-web is a web application designed to maintain and organize data for analysis by ORIO. ORIO-web also provides dynamic visualization of ORIO results. Together ORIO and ORIO-web allow for fast, flexible, and informative integration of whole-genome data with an intuitive web interface.
Account management
The ORIO-web landing page asks a user to generate an account associated with an email address. All data and analyses managed by ORIO-web are associated with a user account. Most data is privately associated with a user account; however, ORIO-web does allow individual analyses to designated as public, allowing for rapid sharing of results by URL address.
Data management
ORIO_web manages inputs for the ORIO analysis package. Feature lists, NGS data sets, and sort vectors are associated with a given user account.
Data management controls are found by clicking on the 'Manage data' link button. On the 'Data management' page, headers designate the 'Feature lists', 'Sort vectors', and 'User dataset' sections. Data may be deleted or modified by clicking on entries under each header, or new entries may be created by clicking on 'Create new' buttons.
When creating new entries, each data type requires a name, an associated genome assembly, and correctly formatted data set. Feature lists may be specified as stranded; if so, strand must be specified for each entry in the associated BED file in the sixth column. Sort vectors must be associated with an existing feature list, and that feature list must be specified upon creation.
NGS data sets are uploaded to the tool as read coverage bigWig files. Given the large size of these files, we require these files to be hosted by user and be publicly accessible by HTTP download. When creating a data set entry, the user must provide a valid URL for HTTP access.
Analysis management
Completed and pending analyses are presented on the ORIO-web dashboard.
- Create analysis. An analysis can be created by clicking on the 'Proceed to run setup' button. An analysis requires a name, genome assembly, and feature list. Upon selecting a genome assembly, drop-down menus for feature list, sort vector, and user-uploaded data sets are populated. Also upon selecting a genomic assembly, ENCODE data selection fields will be populated. ENCODE data selection was designed to navigate through the diverse data generated by the ENCODE project. Fields such as 'Data type', 'Cell type', and 'Antibody' may be used to quickly filter down all ENCODE data sets to a list passing filter criteria. The user may then select individual data from this filter list.
- Execute analysis. After all fields and options are specified, the analysis may be saved. Upon saving, the analysis will be subject to a validation step. Following validation, the analysis may be started by clicking the 'Execute' button on the analysis page. Upon completion of analysis, a message will be sent by email to the user.
- Modify existing analysis. An analysis may be modified from the dashboard by clicking on a completed or pending analysis and selecting 'Update' from the 'Actions' drop-down on the analysis page. From there, the analysis parameters may be modified. An analysis may also be deleted by selecting 'Delete' from the 'Actions' drop-down menu and confirming the selection.
Analysis visualization
ORIO-web provides an intuitive interface for investigating analysis results. The visualization interface may be accessed for a completed analysis by selecting that analysis on the dashboard and clicking 'View visualization' on the analysis page. The results of an ORIO analysis may also be downloaded as a zip file by selecting 'Download zip' from the 'Actions' drop-down on an analysis page.
Dataset clustering, without a sort vector.
- Data sets were hierarchically clustered based on Spearman rho values. Clustering results are shown as a dendrogram on the left side of the top panel. Rho values are reported by color in an n-by-n heatmap, where n is the number of data sets. Rho values may also be found in tooltips when hovering over individual cells. By clicking on a cell, a scatterplot will be generated showing the points used to derive the Spearman rho value. A drop-down menu allows for individual values to be investigated on a bin-by-bin basis.
- In the bottom panel, individual data sets may be selected in the list on the left. Once selected, the bar plot on the right will be populated with pairwise Spearman correlation values for each other data set. After clicking on ‘Display individual heatmap’, a window will pop up detailing the read coverage for that data set over the feature list.
- In the pop up, a heatmap of read coverage over the user-specified genomic window is shown on the right. In the upper-left panel, a plot of bin-average read coverage is shown. In the mid-left panel, a plot of bin-average read coverage over quartiles is shown. Quartiles are generated respecting the sort order of the read coverage heatmap. The sort order of heatmap may be changed using the lower-left panel. By selecting a data set and clicking ‘Reorder heatmap’ the heatmap will be re-ordered to reflect read coverage of the selected data set in descending order, ie genomic features with greater read coverage in the selected data set will be on top. The quartile plot will change upon re-ordering of the read coverage heatmap. The p-value in the upper-left corner of the quartile plot is derived from application of the four-sample Anderson-Darling test to the quartile plots and reflects the null hypothesis that quartiles are sampled from populations that are identical.
Dataset clustering, with a sort vector.
- Data sets were hierarchically clustered. For each data set, the read coverage sum across each bin found. Then, for each given bin, the Spearman rho value is found between the bin read coverage sums and the sort vector. For each data set, these correlation values are concatenated in a single data vector. The data sets are hierarchically clustered using the pairwise Euclidean distance between each data set. Rho values are displayed by color gradient in a n-by-m heatmap, where n is the number of data sets and m is the number of genomic bins. By clicking on a cell, a scatterplot will be generated showing the points used to the derive the Spearman rho value.
- In the bottom panel, individual data sets may be selected in the list on the left. Once selected, the bar plot on the right will be populated with Spearman correlation values for each genomic bin. After clicking on ‘Display individual heatmap’, a window will pop up detailing the read coverage for that data set over the feature list.
- In the pop up, a heatmap of read coverage over the user-specified genomic window is shown on the right. In the upper-left panel, a plot of bin-average read coverage is shown. In the mid-left panel, a plot of bin-average read coverage over quartiles is shown. Quartiles are generated respecting the sort order of the read coverage heatmap. The sort order of heatmap may be changed using the lower-left panel. By selecting a data set and clicking ‘Reorder heatmap’ the heatmap will be re-ordered to reflect read coverage of the selected data set in descending order, i.e. genomic features with greater read coverage in the selected data set will be on top. The quartile plot will change upon re-ordering of the read coverage heatmap. The p-value in the upper-left corner of the quartile plot is derived from application of the four-sample Anderson-Darling test to the quartile plots and reflects the null hypothesis that quartiles are sampled from populations that are identical.
Feature clustering.
- Genomic features are clustered using k-means clustering. For each genomic feature, sum of the read coverage for each data set is found. These sums are then normalized such that each value is in terms of units variance. These normalized sums are concatenated into data vectors for each genomic feature. k-means clustering is then performed on these data vectors. Centroids are initialized by randomly selecting individual data vectors. k-means clustering is iteratively performed for k values 2 to 10.
- In the 'Feature clustering' view, clustering results are shown on the heatmap in the right panel. Here, each row corresponds to a genomic feature, and each column corresponds to a data set. In each cell, the color represents the read coverage at a genomic feature for a data set after upper-quartile normalization. Columns are ordered based on hierarchical clustering results with a dendrogram at the top of the panel. Bars on the left side of the panel reflect cluster membership.
- In the left panel, k values may be selected from a drop-down list. Members of the selected cluster are displayed in a list at the bottom of the left panel. If selected, a genomic feature will be indicated in the heatmap by a black arrow. Also, the values of the selected genomic feature will be displayed on the centroid chart in the bottom panel.
- In the bottom panel, a two-dimensional plot displays read coverage values for cluster centroids. Values are upper-quartile normalized. If a genomic feature is selected in the upper panel, read coverage values for that feature will be plot as a black line.